. 2018 Mar 13;10(3):725-738.
doi: 10.1016/j.stemcr.2018.01.028. Epub 2018 Mar 1.

Heterogeneity of SOX9 and HNF1β in Pancreatic Ducts Is Dynamic

Affiliations

Heterogeneity of SOX9 and HNF1β in Pancreatic Ducts Is Dynamic

Habib Rezanejad et al. Stem Cell Reports. .

Abstract

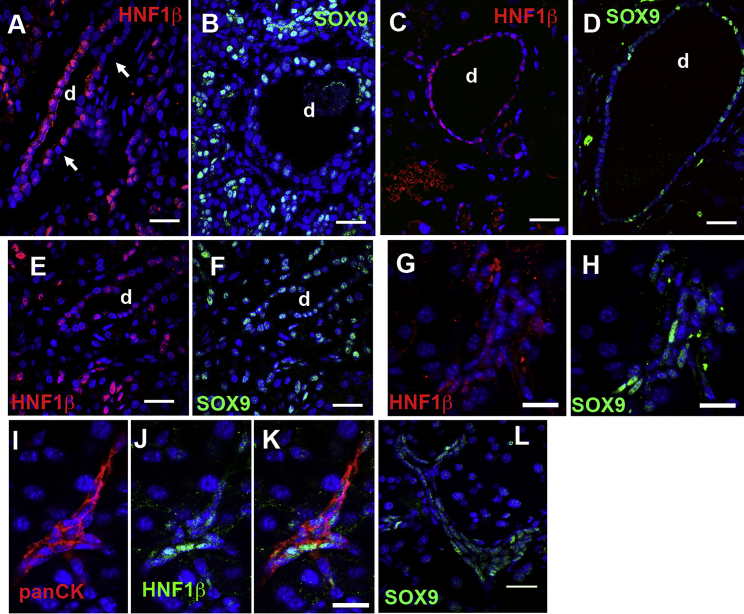
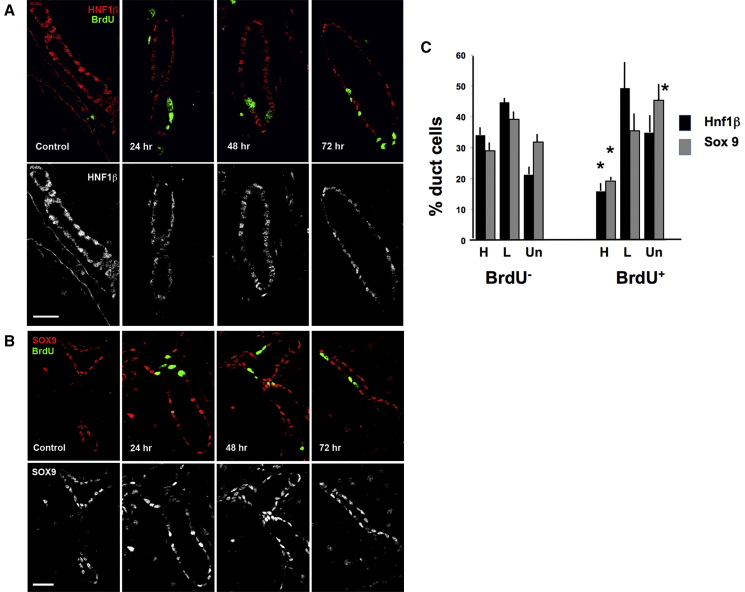
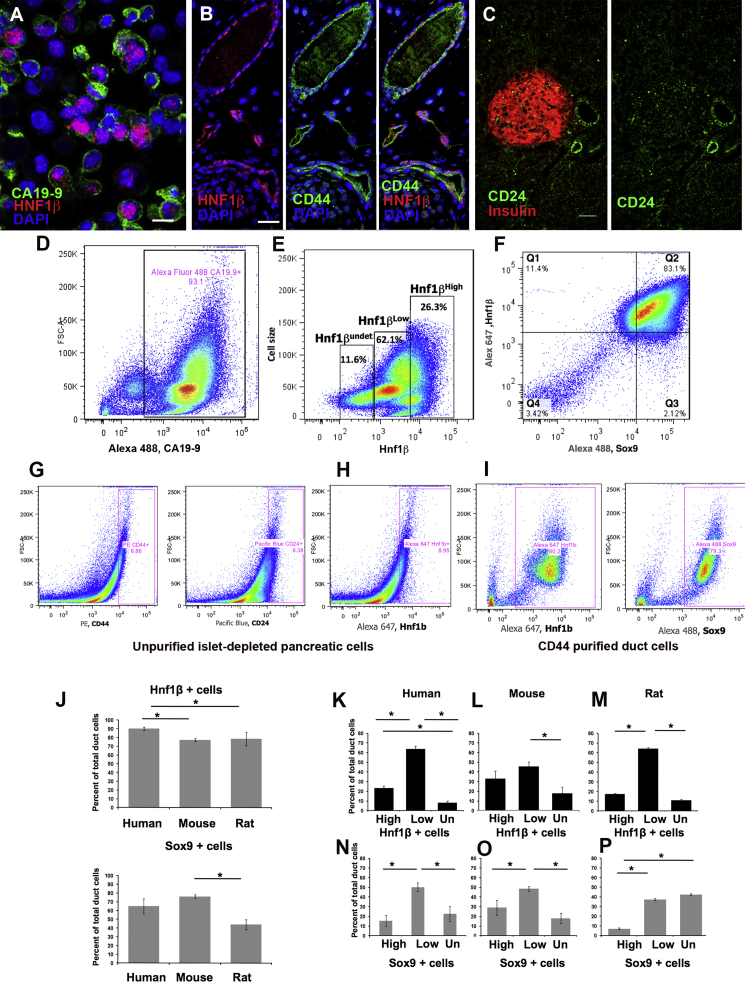
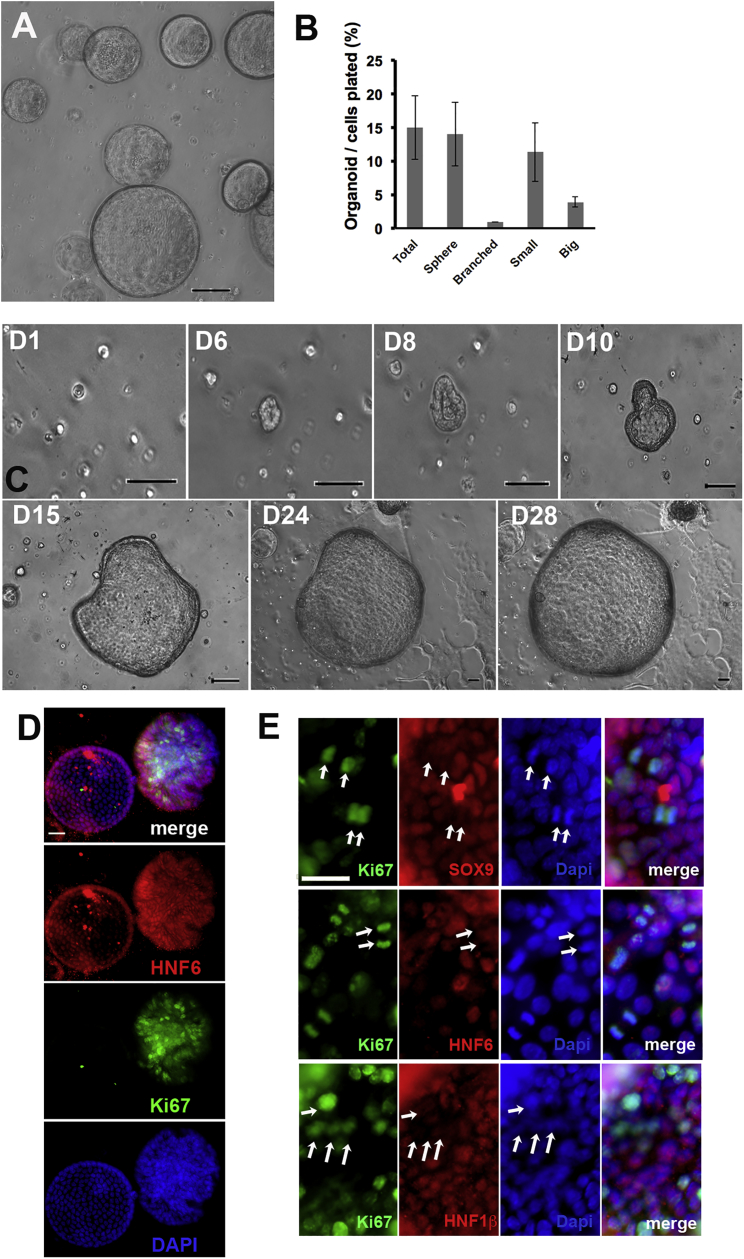
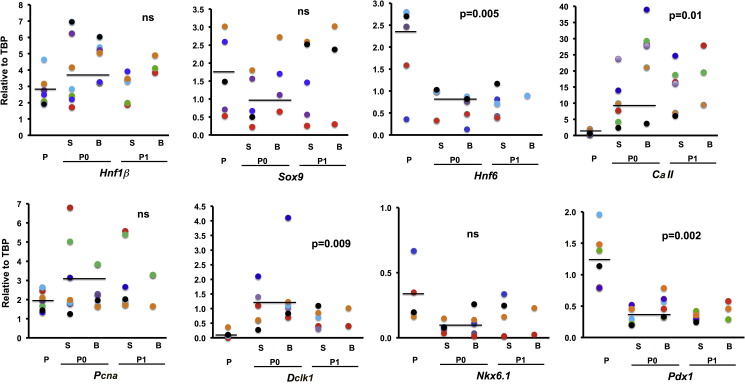
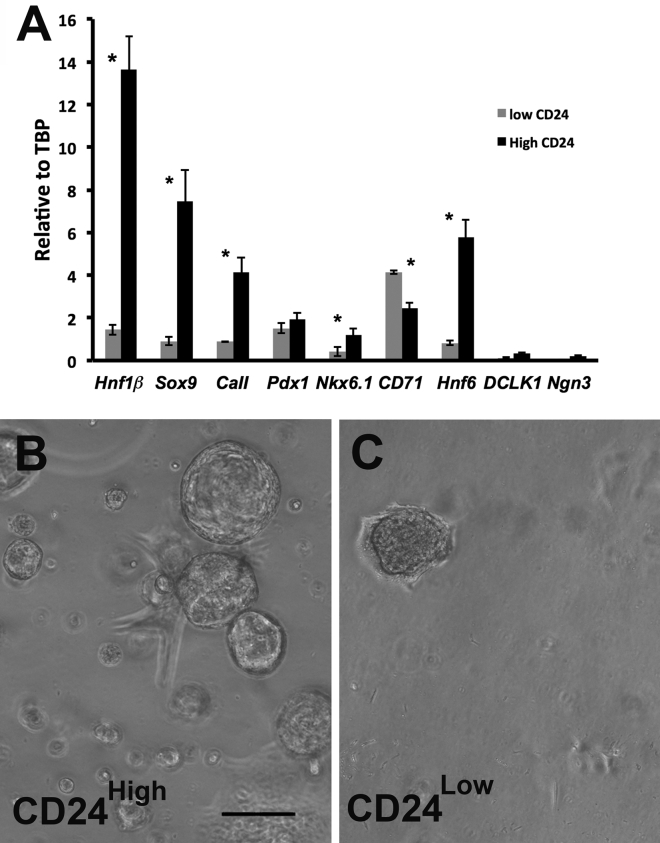
Pancreatic duct epithelial cells have been suggested as a source of progenitors for pancreatic growth and regeneration. However, genetic lineage-tracing experiments with pancreatic duct-specific Cre expression have given conflicting results. Using immunofluorescence and flow cytometry, we show heterogeneous expression of both HNF1β and SOX9 in adult human and murine ductal epithelium. Their expression was dynamic and diminished significantly after induced replication. Purified pancreatic duct cells formed organoid structures in 3D culture, and heterogeneity of expression of Hnf1β and Sox9 was maintained even after passaging. Using antibodies against a second cell surface molecule CD51 (human) or CD24 (mouse), we could isolate living subpopulations of duct cells enriched for high or low expression of HNF1β and SOX9. Only the CD24high (Hnfβhigh/Sox9high) subpopulation was able to form organoids.

Keywords: heterogeneity; organoid; pancreatic ductal cells.


Figures

Figure 1
Figure 1
Heterogeneity of HNF1β and SOX9 Proteins in Adult Human and Mouse Pancreas In humans, HNF1β (red) (A) has heterogeneous expression even within the same duct and some cells have undetectable levels (white arrows); SOX9 (green) expression (B) is also heterogeneous, stronger in small terminal ducts than in larger ducts (center). Similarly, in mouse, higher and more homogeneous staining of HNF1β (C) and lower, more heterogeneous SOX9 staining (D), is seen in large ducts than in small ducts. Heterogeneity of HNF1β and SOX9 expression only partially overlaps in human (E and F) and mouse (G and H) pancreas. Double-stained SOX9 (green) HNF1β (red) sections shown as split channels. In mouse small terminal ducts (Pan Cytokeratin red), some cells present high levels of HNF1β (green), and the rest are either HNF1βlow or HNF1βundetectable (I–K), whereas SOX9 (L) is expressed in most. DAPI (blue)-stained nuclei. d, ducts. Scale bars, 25 μm (A–F and L), 50 μm (G, H, and K).
Figure 2
Figure 2
Replicating Duct Cells Have Reduced High-Intensity Staining for HNF1β and SOX9 (A and B) Eighteen hours after KGF administration, BrdU was injected and the animals were killed at different times of “chase.” BrdU labeling significantly increased (24 hr, 8.9% ± 0.5%; 48 hr, 13.1% ± 0.8%; 72 hr, 14.6% ± 1.0%) in KGF-injected mice compared with controls (0.7% ± 0.4%; p < 0.001). BrdU, green (A and B); HNF1β, red (A); and SOX9, red (B) immunostaining shown merged (top) and as single channel (lower). (C) Quantification showed that, in the replicating (BrdU+) duct cells, the percentage of both HNF1βhigh and SOX9high cells decreased and SOX9undetectable significantly increased compared with quiescent (BrdU) at all time points. These proportions did not differ in Control and BrDU cells at any time point so the values were combined; similarly the BrdU+ did not differ at any time point and so were combined. n = 3 mice/group; 536–1,474 duct cells each time. Data are means ± SEM. p < 0.05. Scale bars, 25 μm.
Figure 3
Figure 3
Flow Cytometry Analysis Showed Heterogeneous Pattern of HNF1β and SOX9 (A) Purified human duct cells stained for HNF1β (red) and CA19-9 (green). Scale bar, 10 μm. (B) CD44 (green) is evident in mouse duct cells as identified by HNF1β (red). Scale bar, 20 μm. (C) CD24 (green) is expressed in duct cells and not in adult islets (insulin, red). Scale bar, 25 μm. (D) Representative FACS confirms the purity with 93.1% isolated human CA19-9+ cells. (E) Human CA19-9+ duct cells were fixed and stained with anti-HNF1β antibodies (x axis) plotted against forward scatter (cell size, y axis). HNF1β+ cells were gated using unstained and primary antibody controls and the percentage of HNF1βundetectable, HNF1βlow, and HNF1βhigh determined Fixed purified huamn ducts immunostained for Sox9 (x axis) and Hnf1β (y axis) (F). (G–I) FACS of dispersed islet-depleted mouse pancreas, without purification, resulted in 6%–8% CD44+, CD24+ cells (G), or HNF1β+ (H), whereas with CD44 purification and subsequent FACS for HNF1β or SOX9 immunostaining (I) duct cells were enriched to about 80%. (J–P) Flow cytometry analysis comparison among human, mouse, and rat showing the mean percentage of duct cells isolated (J). Human (n = 8 donors; 266,473 cells/donor); mouse (initially purified by CD44 or CD24, n = 6, each pooled from 15 mice; 257,011 cells/experiment); rat pancreas (initially purified by CD44 or CD24, n = 4, each pooled from 15 rats; 70,799 cells/experiment). The percentages of HNF1βhigh, HNF1βlow, HNF1βundetectable in human (K), mouse (L), and rat (M), and of SOX9high, SOX9low, and SOX9undetectable in human (N), mouse (O), and rat (P) varied among species. p < 0.03. Data are means ± SEM.
Figure 4
Figure 4
Murine Duct-Derived Organoids Show Heterogeneous Expression of HNF1β and SOX9 Proteins, with a Lower Expression in Proliferating Cells (A) Duct cells robustly formed organoids after 2 weeks in Matrigel. n = 10 experiments. Scale bar, 200 μm. (B) By 13 days of culture, about 15% of purified mouse duct cells formed organoids, mostly smooth spheres, but 7% of organoids were branched structures. n = 3 experiments, each at least 1,000 organoids counted. (C) Representative time-lapse images over 28 days (D1–D28) of organoid formation from single mouse duct cells, confirming that the organoids arise from proliferation and not aggregation. n = 2 experiment, each with 5 fields followed. Scale bar, 100 μm. (D) Proliferation marker Ki67 was highly, but variably, expressed in organoids: left, a smooth sphere; right, branched structure. (E) Ki67+ cells (arrows) had very low or undetectable expression of SOX9, HNF6, and HNF1β (n = 3 experiments). Data are means ± SEM. Scale bars, 25 μm (D and E).
Figure 5
Figure 5
Organoids Maintain Expression of Ductal Markers after Passaging Freshly isolated murine duct cells (P), handpicked organoids after 2 weeks (P0), and 7 days after first passage (P1) showed similar expression of Sox9 and Hnf1β mRNA, whereas Hnf6 and Pdx1 decreased (p < 0.005), and CaII and Dckl1 increased in organoids, compared with primary duct cells (p < 0.01). Nkx6.1 expression did not differ; Pcna expression was highly variable. S, sphere; B, branched. Each experiment color coded. Means shown. p value compared P0 with P. ns, not significant. See also Figure S1.
Figure 6
Figure 6
Two Distinct Populations within Duct Cells Based on CD24 Expression in CD44+ Purified Murine Duct Cells (A) CD44+ purified duct cells FACS sorted with anti-CD24 antibody showed CD24high and CD24low populations with distinct gene expression patterns. n = 3 experiments, 5 mice each. See Tables S2 and S3. Similar data for human ducts (CD51) and for mouse (a second CD24 antibody) are shown in Figure S3. CD24high duct cells were able to form organoids reproducibly (B), whereas CD24low cells (C) formed few, if any, organoids after 1 week. n = 4 experiments. Data are means ± SEM. p < 0.05. Scale bar, 200 μm.
Figure 7
Figure 7
Organoids Can Differentiate to Endocrine Progenitor-like Cells (A) Schematic of directed differentiation of P2 organoids to endocrine progenitor-like cells using protocol modified from Rezania et al. (2014). (B) Through the protocol, organoids continued to express Pdx1 mRNA at levels equal or greater than that of E16 pancreas, Nkx6.1 mRNA expression increased, reaching 25% that of E16 pancreas, Ngn3 mRNA (p < 0.001) and Mafb mRNA, which is expressed in the earliest insulin-expressing cells, were induced (p < 0.002). n = 3 experiments, color-coded. Ctrl, control; Diff, differentiation.

Similar articles

Cited by

References

    1. Al-Hajj M., Wicha M.S., Benito-Hernandez A., Morrison S.J., Clarke M.F. Prospective identification of tumorigenic breast cancer cells. Proc. Natl. Acad. Sci. USA. 2003;100:3983–3988. - PMC - PubMed
    1. Al-Hasani K., Pfeifer A., Courtney M., Ben-Othman N., Gjernes E., Vieira A., Druelle N., Avolio F., Ravassard P., Leuckx G. Adult duct-lining cells can reprogram into β-like cells able to counter repeated cycles of toxin-induced diabetes. Dev. Cell. 2013;26:86–100. - PubMed
    1. Baeyens L., Lemper M., Leuckx G., De Groef S., Bonfanti P., Stange G., Shemer R., Nord C., Scheel D., Pan F. Transient cytokine treatment induces acinar cell reprogramming and regenerates functional β-cell mass in diabetic mice. Nat. Biotechnol. 2014;32:76–83. - PMC - PubMed
    1. Baron M., Veres A., Wolock S.L., Faust A.L., Gaujoux R., Vetere A., Ryu J.H., Wagner B.K., Shen-Orr S.S., Klein A.M. A single-cell transcriptomic map of the human and mouse pancreas reveals inter- and intra-cell population structure. Cell Syst. 2016;3:346–360.e4. - PMC - PubMed
    1. Beer R.L., Parsons M.J., Rovira M. Centroacinar cells: at the center of pancreas regeneration. Dev. Biol. 2016;413:8–15. - PMC - PubMed

Publication types

LinkOut - more resources