. 2018 Mar 13;10(3):1160-1174.
doi: 10.1016/j.stemcr.2018.01.022. Epub 2018 Mar 1.

High-Yield Purification, Preservation, and Serial Transplantation of Human Satellite Cells

Affiliations

High-Yield Purification, Preservation, and Serial Transplantation of Human Satellite Cells

Steven M Garcia et al. Stem Cell Reports. .

Abstract

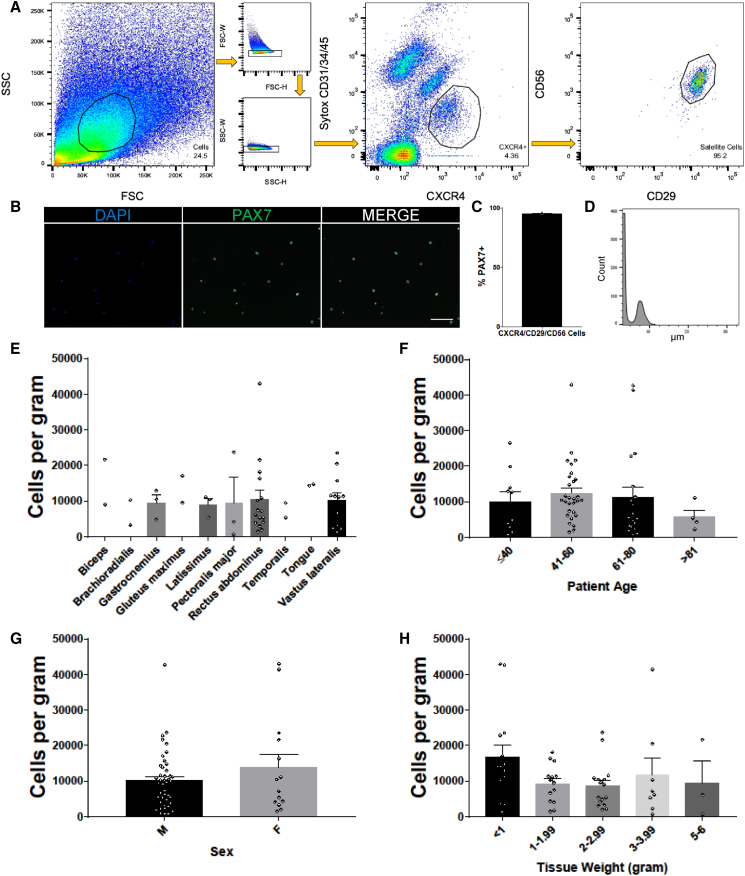
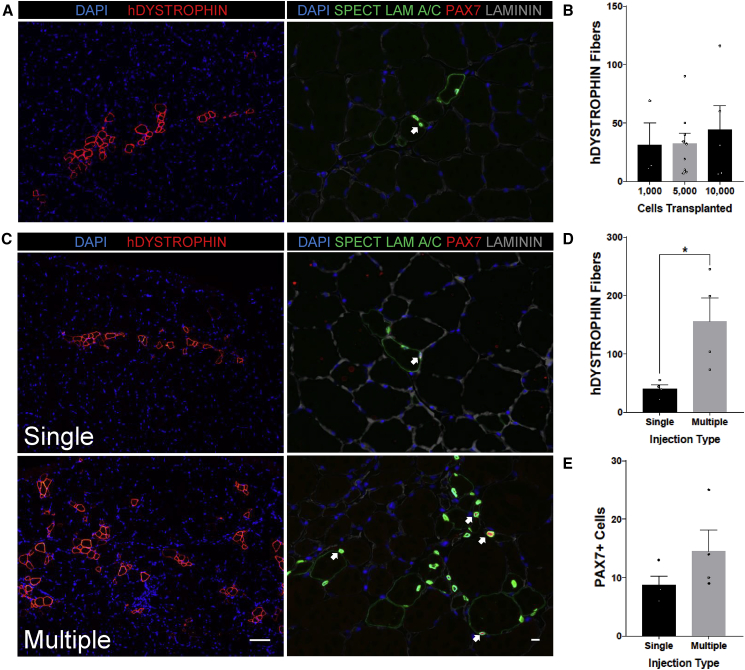
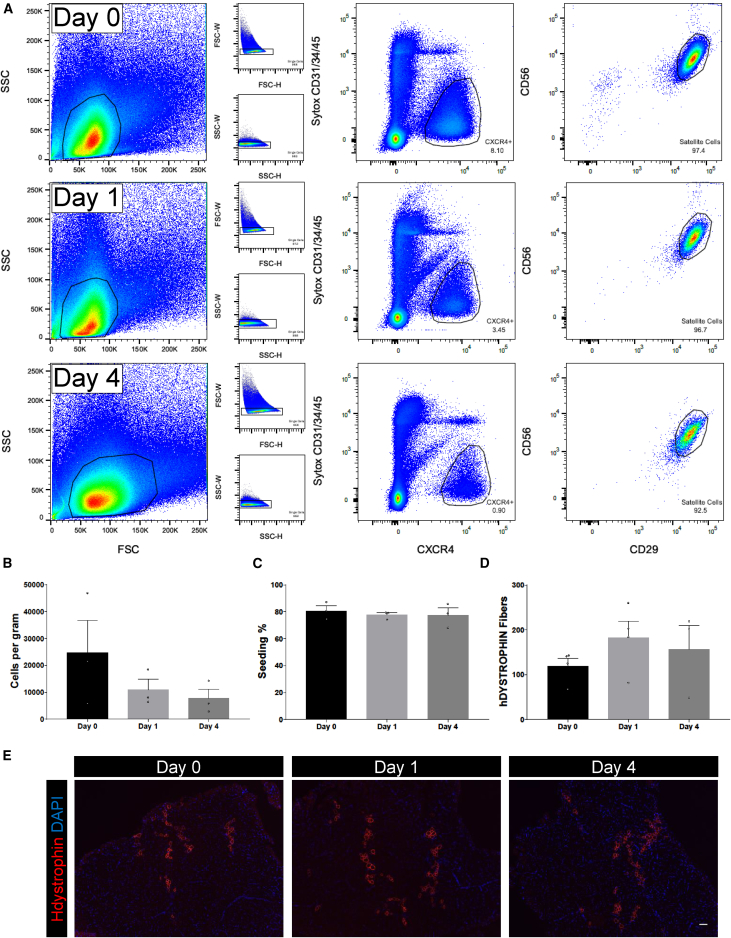
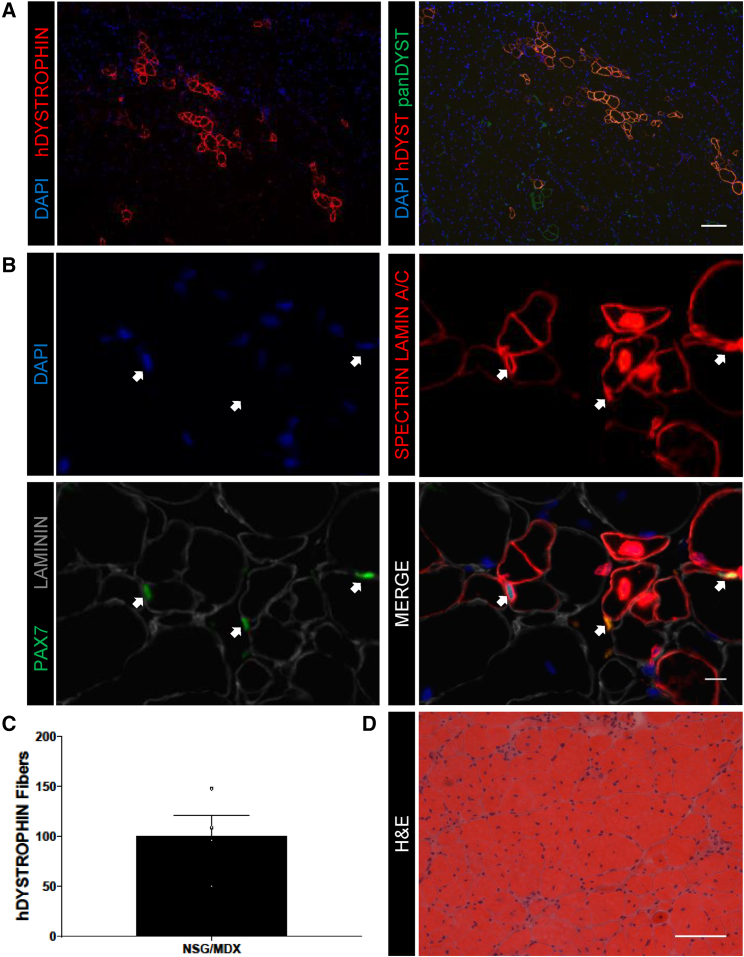
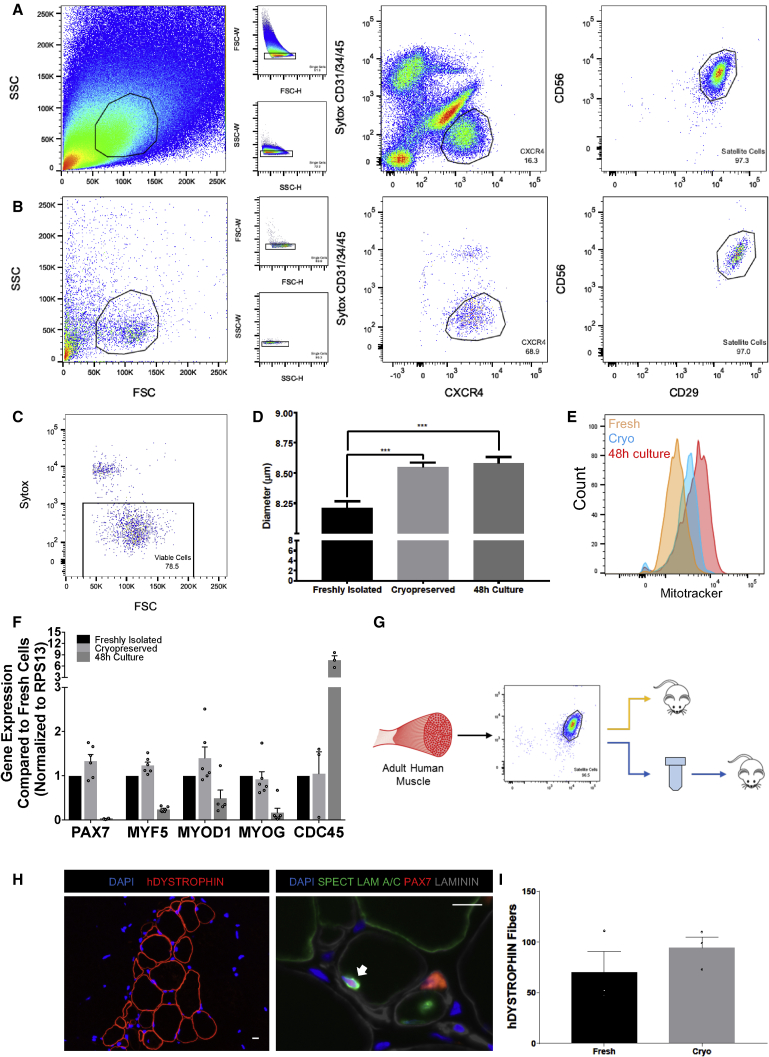
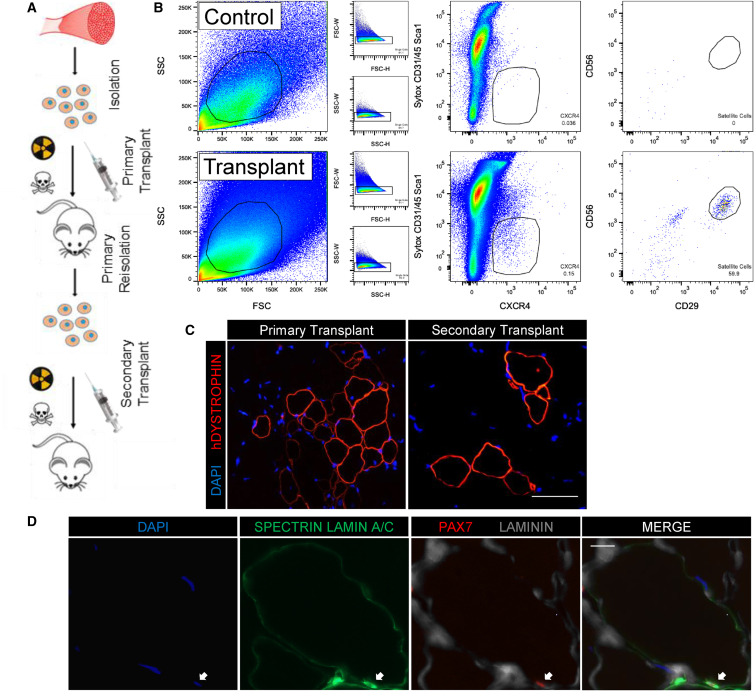
Investigation of human muscle regeneration requires robust methods to purify and transplant muscle stem and progenitor cells that collectively constitute the human satellite cell (HuSC) pool. Existing approaches have yet to make HuSCs widely accessible for researchers, and as a result human muscle stem cell research has advanced slowly. Here, we describe a robust and predictable HuSC purification process that is effective for each human skeletal muscle tested and the development of storage protocols and transplantation models in dystrophin-deficient and wild-type recipients. Enzymatic digestion, magnetic column depletion, and 6-marker flow-cytometric purification enable separation of 104 highly enriched HuSCs per gram of muscle. Cryostorage of HuSCs preserves viability, phenotype, and transplantation potential. Development of enhanced and species-specific transplantation protocols enabled serial HuSC xenotransplantation and recovery. These protocols and models provide an accessible system for basic and translational investigation and clinical development of HuSCs.

Keywords: human satellite cell purification; satellite cell cryopreservation; serial transplantation.


Figures

Figure 1
Figure 1
Optimized Isolation of Human Satellite Cells from Postnatal Muscle Tissue (A) Representative flow-cytometry profiles of HuSCs gated for live singlets expressing the surface marker profile CD31/CD34/CD45/CXCR4+/CD29+/CD56+. Cells gated are outlined in black within each plot. The percentage of events in each gating step is shown in each plot (n = 57). (B) HuSCs were collected stained for PAX7 expression (n = 3). Scale bar 100 μm. (C) Bar graph representation of PAX7 immunoreactivity in seeded HuSCs (n = 3). (D) Representative histogram of HuSC diameters after a satellite cell isolation from a single muscle sample (n = 3). Left peak consists of small debris. (E) Bar plot showing the average number of HuSCs isolated per gram, stratified by muscle type. There were no statistically significant differences (n = at least two samples per muscle type). (F) Bar plot depicting the average number of cells isolated per gram stratified by donor age. There were no statistical differences among any of the age groups when grouped by age (p = 0.610) or with linear regression analysis (p = 0.474). (G) Bar plot depicting the average number of cells isolated per gram separated by donor gender shows no statistically significant difference (p = 0.343). (H) Bar plot depicting the average number of cells isolated per gram arranged by tissue weight shows no statistically significant differences among any of the weight groups. Data presented as mean ± SEM. See Table S1 for complete sample details and individual n values, which denote individual donors and experiments, and Table S2 for all statistics and p values. See also Figures S1 and S2.
Figure 2
Figure 2
Enhanced Engraftment of HuSCs by Multiple-Site Injection (A) Representative images of a conventional transplant with a single injection with 10,000 cells per TA (n = 5, biological replicates). TA cross-sections were stained with human DYSTROPHIN (left) for human fibers or with human-specific SPECTRIN, LAMIN A/C, Laminin, and PAX7 for HuSCs (right). Satellite cells are marked with an arrow. (B) Bar graph representation of human fiber engraftment with varying dosage of transplanted cells. Isolated satellite cells were transplanted in a single injection of either 1,000 (n = 3), 5,000 (n = 9), or 10,000 (n = 5) cells. n Values denote biological replicates. Human DYSTROPHIN-positive fibers were counted in TA cross-sections, and the y axis value indicates the number of fibers within the cross-section containing the maximum number of human-derived fibers. The number of engrafted fibers was not significantly different among the three groups. (C) Satellite cells were transplanted in either a single injection (top panels) or with multiple injection sites (bottom panels) with a dose of 2,000 cells per TA. TA cross-sections were stained with human DYSTROPHIN (left) for human fibers or with human-specific SPECTRIN, LAMIN A/C, Laminin, and PAX7 for HuSCs (right) (n = 4 biological replicates). Satellite cells are marked with arrows. Scale bars, 100 μm (left panels; also applies to A) and 10 μm (right panels; also applies to A). (D) Bar graph showing the engraftment of human myofibers after transplantation as assessed by human DYSTROPHIN staining (n = 4 per group, individual mice). (E) Bar graph showing the average engraftment of PAX7-positive HuSCs per cross-section after transplantation (n = 4 per group, individual mice). Data presented as mean ± SEM. p < 0.05. All samples were processed the morning after tissue collection, within 12 hr after muscle biopsy. All mice were analyzed 5 weeks after transplantation. See also Figure S3.
Figure 3
Figure 3
HuSC Isolation from Stored Muscle (A) HuSCs were isolated as previously described from resected adult muscle either immediately after resection or after a storage period of 1 or 4 days in 30% FBS at 4°C. Representative flow-cytometry profiles of HuSC isolation after each condition are shown (n = 3 biological replicates). Cells gated are outlined in black within each plot. The percentage of events in each gating step is shown in each plot. (B) Bar graph depicting the average number of HuSCs isolated per gram of muscle on each day processed. No statistically significant difference among the three groups (n = 3 biological replicates). (C) Bar graphs demonstrating the average percentage of HuSCs adhering onto Terasaki wells after isolation and seeding. There was no statistically significant difference among the three groups (n = 3 biological replicates). (D) Bar graph showing the number of human myofibers engrafted in each mouse TA after xenotransplantation with 2,000 HuSCs into NSG TA muscles with cells isolated on day 0 (n = 4), day 1 (n = 4), or day 4 (n = 3) after biopsy (n values denote individual mice). There was no significant difference in the average engraftment of each condition. (E) Representative images of human myofiber engraftment after xenotransplantation (n = 3 biological replicates). Scale bar, 100 μm. Data presented as mean ± SEM. See also Figure S4.
Figure 4
Figure 4
Xenotransplantation of HuSCs into NSG/MDX Compound Mutant Mice (A) Representative images of engrafted human fibers in NSG/MDX TA muscle after transplantation with HuSCs (n = 4 biological replicates). Left: human-specific DYSTROPHIN. Right: costaining for human-specific DYSTROPHIN and pan-sensitive Dystrophin. Orange fibers represent costaining and green fibers represent revertant fibers. Scale bar, 100 μm. (B) Representative images of HuSC engraftment after transplantation into NSG/MDX TA (n = 4 biological replicates). HuSCs are denoted by sublaminar location and expression of human-specific LAMIN A/C and PAX7, marked by arrows. Scale bar, 10 μm. (C) Bar graph showing quantification of human fiber engraftment in the NSG/MDX TAs identified by human-specific DYSTROPHIN staining (n = 4 individual mice). Data presented as mean ± SEM. (D) Representative H&E of an NSG/MDX TA cross-section after transplantation with HuSCs (n = 4 biological replicates). Scale bar, 100 μm.
Figure 5
Figure 5
HuSC Phenotype and Function after Cryopreservation (A) Flow-cytometry profile of an HuSC isolation from the rectus abdominis muscle of a 43-year-old male. (B) Isolated HuSCs (A) were cryopreserved and thawed, then restained and sorted. In (A and B), cells gated are outlined in black within each plot. The percentage of events in each gating step is shown in each plot. (C) Sytox blue flow-cytometry profile for sorted satellite cells in (B) demonstrating >75% viability after cryopreservation. (D) Representative bar graph showing the average difference in satellite cell size among freshly isolated, cryopreserved, and 48-hr cultured cells (n = 490, 2,037, and 1,942 cells, respectively, from three biological replicates). ∗∗∗p < 0.001. (E) Representative histograms of freshly isolated satellite cells (orange), cryopreserved cells (blue), and 48-hr cultured cells (red) assessed by MitoTracker flow-cytometry assay (n = 3 biological replicates). “Count” denotes number of cells. Complete profiles are shown in Figure S5. (F) Bar plots of qRT-PCR data comparing the expression of PAX7, MYF5, MYOD1, MYOG (n = 6), and CDC45 in satellite cells from freshly isolated, cryopreserved, and 48-hr cultured cell groups (n = 3). n Values denote technical replicates from two independent biological samples. Gene expression was normalized to the housekeeping gene RPS13. (G) Schematic depicting experimental approach to compare the engraftment of cryopreserved and fresh HuSCs from the same muscle tissue. (H) Representative images after transplantation with 2,000 cryopreserved HuSCs, of human fiber engraftment (left) and of repopulation the niche (right) with HuSCs (arrows) (n = 3 biological replicates). Scale bars, 10 μm. (I) Bar graph depicting the engraftment of human fibers after transplantation with freshly isolated versus cryopreserved HuSCs quantified by human-specific DYSTROPHIN staining. There was no significant difference in engraftment (n = 3 individual mice). Data presented as mean ± SEM. See also Figure S5.
Figure 6
Figure 6
Serial Isolation and Transplantation of HuSCs (A) Schematic depicting the experimental design of serial isolation and transplantation of primary HuSCs. Syringe, cell suspension injection; skull and crossbones, bupivacaine; hazard symbol, radiation. (B) Representative flow-cytometry profiles of a primary reisolation. HuSCs are CXCR4/CD29/CD56-positive located within the outline in the right plot and were only seen in muscle originally transplanted with donor HuSCs (bottom) compared with no HuSCs seen in digests from contralateral control muscle (top) (n = 3). Cells gated are outlined in black within each plot. The percentage of events in each gating step is shown in each plot. (C) Representative image of human fiber formation in mice transplanted with primary reisolated HuSCs indicating engraftment (n = 3). Scale bar, 100 μm. (D) Images of HuSC repopulation of the satellite cell niche after secondary transplantation. Immunofluorescence staining for PAX7, SPECTRIN, LAMIN A/C, and Laminin demonstrates human PAX7-positive cells in the sublaminar satellite cell niche in mice transplanted with primary reisolated HuSCs (arrow) (n = 3). Scale bar, 10 μm. All n values denote biological replicates.

Similar articles

Cited by

References

    1. Alexander M.S., Rozkalne A., Colletta A., Spinazzola J.M., Johnson S., Rahimov F., Meng H., Lawlor M.W., Estrella E., Kunkel L.M. CD82 is a marker for prospective isolation of human muscle satellite cells and is linked to muscular dystrophies. Cell Stem Cell. 2016;19:800–807. - PMC - PubMed
    1. Bareja A., Holt J.A., Luo G., Chang C., Lin J., Hinken A.C., Freudenberg J.M., Kraus W.E., Evans W.J., Billin A.N. Human and mouse skeletal muscle stem cells: convergent and divergent mechanisms of myogenesis. PLoS One. 2014;9:e90398. - PMC - PubMed
    1. Beauchamp J.R., Heslop L., Yu D.S., Tajbakhsh S., Kelly R.G., Wernig A., Buckingham M.E., Partridge T.A., Zammit P.S. Expression of CD34 and Myf5 defines the majority of quiescent adult skeletal muscle satellite cells. J. Cell Biol. 2000;151:1221–1234. - PMC - PubMed
    1. Brimah K., Ehrhardt J., Mouly V., Butler-Browne G.S., Partridge T.A., Morgan J.E. Human muscle precursor cell regeneration in the mouse host is enhanced by growth factors. Hum. Gene Ther. 2004;15:1109–1124. - PubMed
    1. Bulfield G., Siller W.G., Wight P.A., Moore K.J. X chromosome-linked muscular dystrophy (mdx) in the mouse. Proc. Natl. Acad. Sci. USA. 1984;81:1189–1192. - PMC - PubMed

Publication types