. 2018 Mar 12;33(3):386-400.e5.
doi: 10.1016/j.ccell.2018.01.012. Epub 2018 Feb 22.

Genome-wide CRISPR-Cas9 Screen Identifies Leukemia-Specific Dependence on a Pre-mRNA Metabolic Pathway Regulated by DCPS

Affiliations

Genome-wide CRISPR-Cas9 Screen Identifies Leukemia-Specific Dependence on a Pre-mRNA Metabolic Pathway Regulated by DCPS

Takuji Yamauchi et al. Cancer Cell. .

Abstract

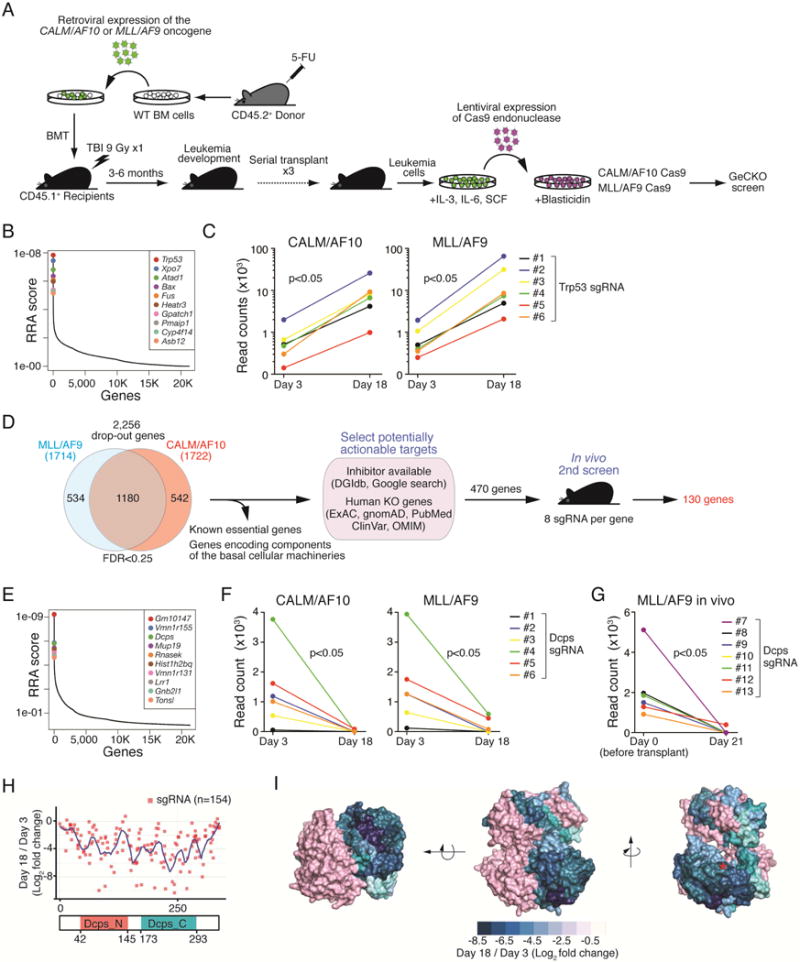
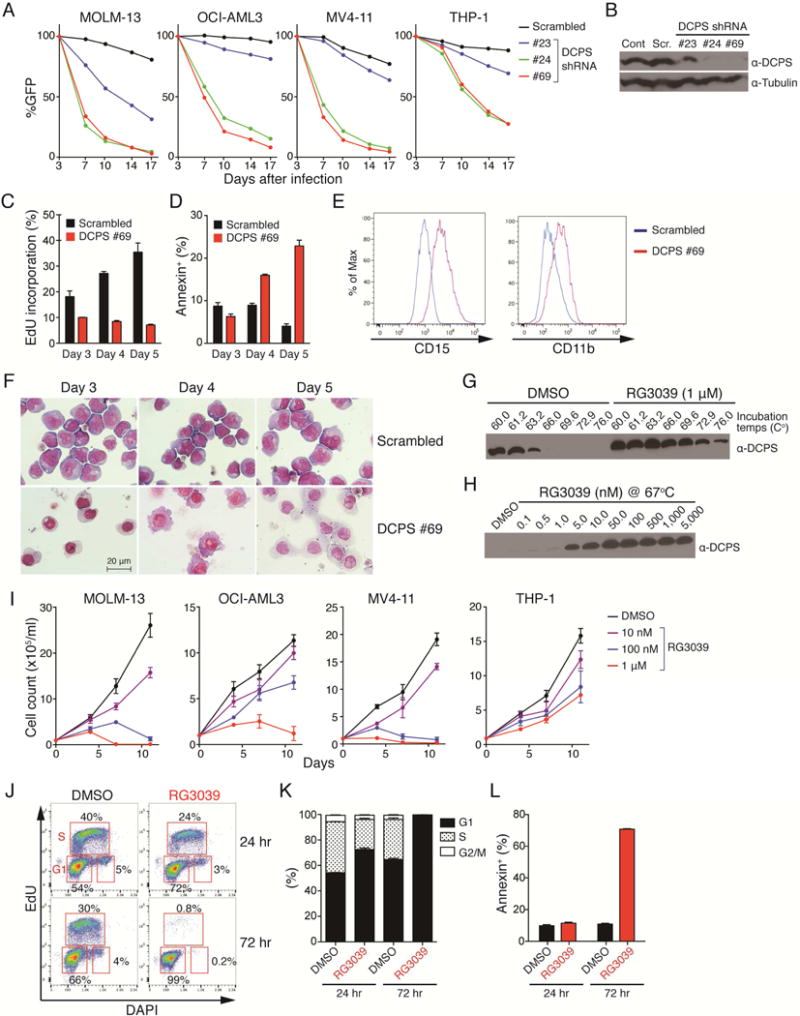
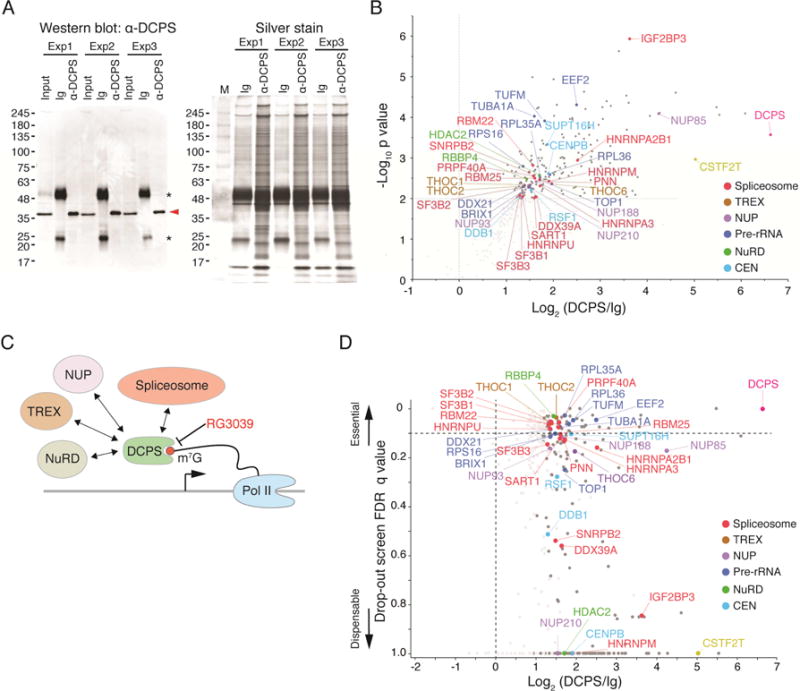
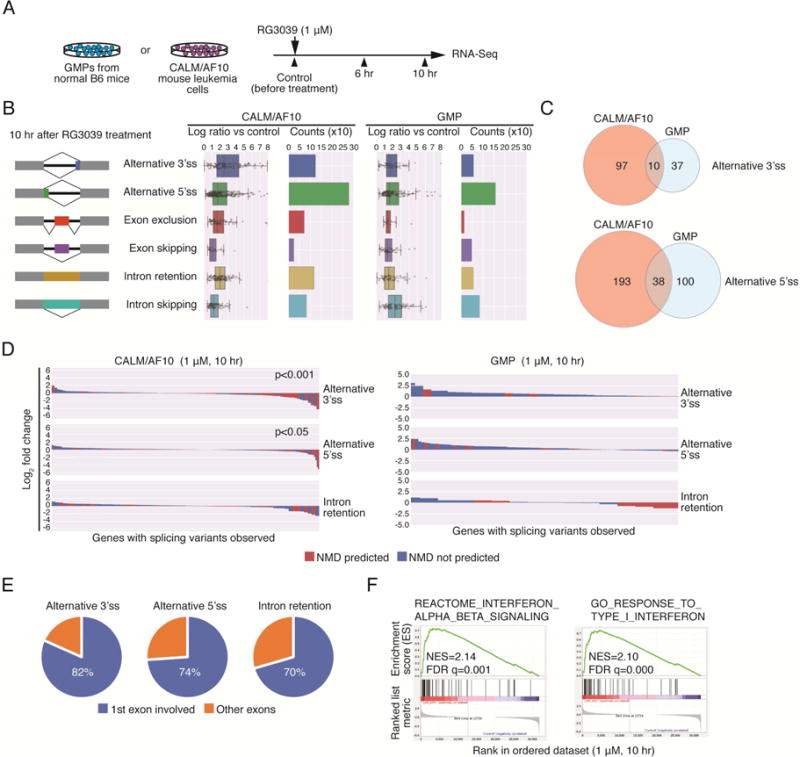
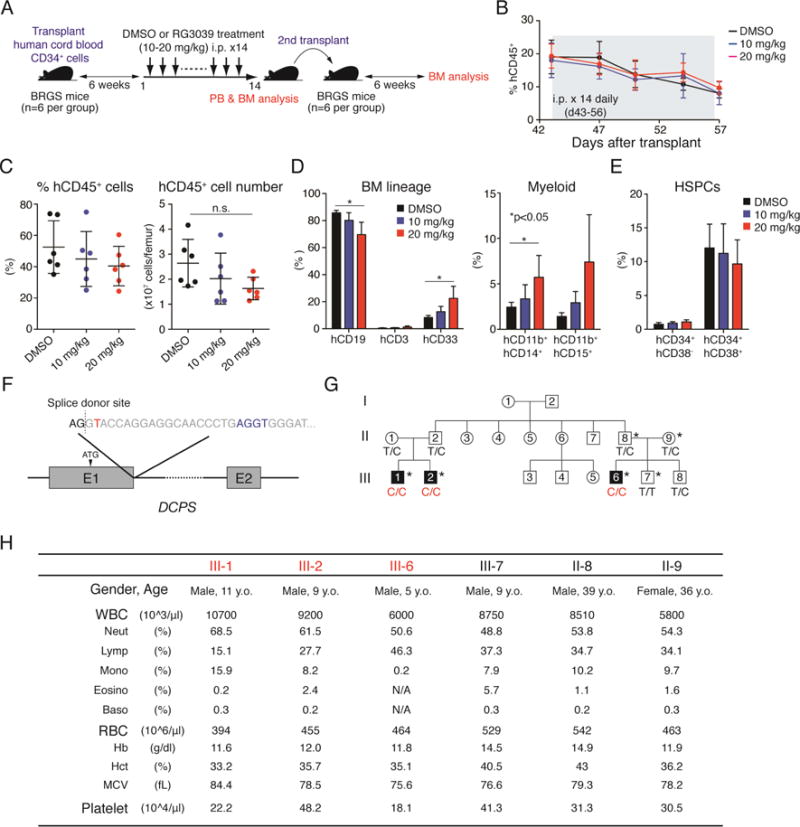
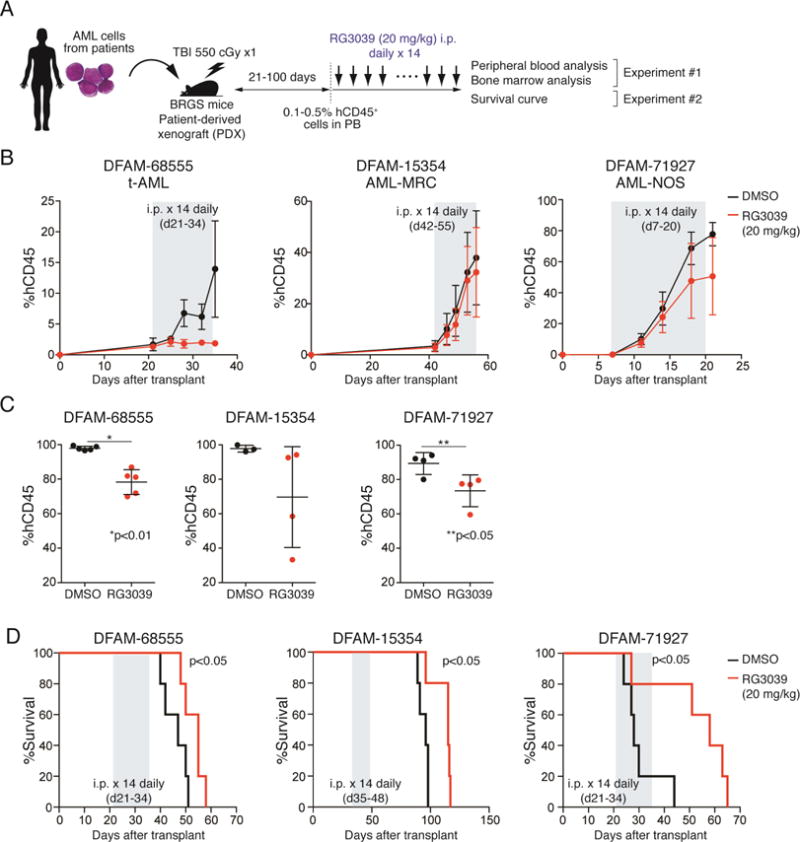
To identify novel targets for acute myeloid leukemia (AML) therapy, we performed genome-wide CRISPR-Cas9 screening using AML cell lines, followed by a second screen in vivo. Here, we show that the mRNA decapping enzyme scavenger (DCPS) gene is essential for AML cell survival. The DCPS enzyme interacted with components of pre-mRNA metabolic pathways, including spliceosomes, as revealed by mass spectrometry. RG3039, a DCPS inhibitor originally developed to treat spinal muscular atrophy, exhibited anti-leukemic activity via inducing pre-mRNA mis-splicing. Humans harboring germline biallelic DCPS loss-of-function mutations do not exhibit aberrant hematologic phenotypes, indicating that DCPS is dispensable for human hematopoiesis. Our findings shed light on a pre-mRNA metabolic pathway and identify DCPS as a target for AML therapy.

Keywords: CRISPR-Cas9 saturation mutagenesis; acute myeloid leukemia; decapping enzyme; drug repurposing; genome-wide CRISPR-Cas9 screening; mRNA decay; pre-mRNA metabolism; pre-mRNA splicing.


Conflict of interest statement

DECLARATION OF INTERESTS

The authors declare no competing interests.

Figures

Figure 1
Figure 1. Genome-wide CRISPR-Cas9 screens identify Dcps as an AML essential gene
(A) Generation of Cas9-expressing mouse AML cell lines. Two mouse lines expressing Cas9 endonuclease (CALM/AF10-Cas9 and MLL/AF9-Cas9) were used for screens. (B) Genes significantly enriched or dropped-out after a 16-day incubation were identified using the MAGeCK program (Li et al., 2014; Shalem et al., 2014). Representative results (GeCKO library B screen in MLL/AF9 cells) of the enrichment screen are shown. A modified robust ranking aggregation (RRA) algorithm was used to rank sgRNAs based on p values (Li et al., 2014; Shalem et al., 2014). (C) Graphs show read counts of individual sgRNAs targeting Trp53 before and after a 16-day incubation. P values were calculated using a Wilcoxon matched-pairs signed rank test. (D) Experimental schema of in vitro and in vivo CRISPR-Cas9 screens. Overall, we identified 130 AML essential genes for further evaluation. (E) A representative RRA score plot showing top dropout genes (GeCKO library B screen in CALM/AF10 cells). (F) Read counts of sgRNAs targeting Dcps significantly decreased after a 16-day incubation in both AML lines. P values were calculated using a Wilcoxon matched-pairs signed rank test. (G) Read counts of single sgRNAs targeting Dcps before and 3 weeks after leukemia transfer are shown. Read counts of 7 sgRNAs are shown, as one out of 8 sgRNA (#14) was not detected on day 0. (H) Domain-saturating DCPS mutagenesis. All NGG-restricted sgRNAs (n=154) were identified within Dcps coding exons. The pool was transduced into CALM/AF10-Cas9 cells and a dropout screen was performed. Read counts from final and initial time points were normalized to non-targeting guides and log2 fold-change in guide abundance was calculated. Guides were then mapped to protein by mapping double-stranded break sites to a codon. (I) Dropout scores (log2 fold-change) for each amino acid were mapped onto a structure publicly available in the Protein Data Bank (PDB ID: 1vlr). Since DCPS forms a homodimer, one monomer is depicted in pink for visual clarity, and scores are divided into bins of 1 log2 fold-change. Red asterisk indicates HIT sequence, where the 7-methylhuaninosine (m7G) cap of mRNA binds. See also Figures S1, S2 and Tables S1, S2 and S3.
Figure 2
Figure 2. Treatment of AML cells with the DCPS inhibitor RG3039 induces cell-cycle arrest, apoptosis and differentiation
(A) Human AML cell lines were transduced with a lentivirus vector encoding an shRNA and GFP cassette, and the fraction of GFP-positive cells was measured at indicated times by FACS. At each time point that proportion was normalized to the number of GFP-positive cells present at day 3 (two days after transduction). Scrambled-shRNA served as control. The data is from one experiment. (B) shRNA knockdown efficiencies were assessed by Western blot. Cont: control sample without transduction. Scr: scrambled shRNA. (C) EdU (5-ethynyl-2′-deoxyuridine) incorporation assay. MOLM-13 cells transduced with either scrambled or DCPS shRNA clone#69 were pulsed with EdU and proportions of EdU-positive cells were assessed by FACS on indicated days after transduction. (D) Proportions of apoptotic cells were assessed by Annexin V staining. (E) Expression levels of surface CD15 and CD11b in MOLM-13 cells were assessed by FACS following shRNA-mediated DCPS knockdown (day 5). (F) May-Giemsa stain of cytospin preparations showing monocytic differentiation of MOLM-13 cells upon DCPS knockdown. (G) Representative result of a cellular thermal shift assay (CETSA). (H) DCPS protein is resistant to heat denaturation in the presence of RG3039 dose-dependently. (I) Growth curves were generated for AML lines treated with RG3039. Data are represented as means ± SD. (J) MOLM-13 cells were pulsed with EdU and treated with either DMSO or RG3039. Proportions of EdU-positive cells and their DNA contents were analyzed by FACS 24 hr and 72 hr after RG3039 treatment. (K) Bar graphs show proportions of cells at each stage of the cell cycle after DMSO or RG3039 treatment. (L) Proportions of apoptotic cells were assessed by Annexin V stain following control DMSO or RG3039 treatment. Data (n=3) are represented as means ± SD. See also Figure S3.
Figure 3
Figure 3. DCPS protein interacts with components of pre-mRNA metabolic pathways
(A) Immunoprecipitation (IP) of endogenous DCPS protein was performed in triplicate. DCPS was detected (red arrowhead) by Western blot when IP was performed with anti-DCPS antibody but not with control immunoglobulins (Ig), indicative of specificity (left). Asterisks denote non-specific immunoglobulin light and heavy chain signals. Protein lysates used for mass spectrometry were analyzed by SDS-PAGE and silver stained (right). (B) Volcano plot displaying results of triplicate IP/mass spectrometry experiments. Y-axis shows negative log10 p values, which represent reproducibility of events among three independent experiments; x-axis indicates log2 ratio of normalized protein abundance between anti-DCPS antibody and control Ig IPs. (C) Proposed model for nuclear DCPS function. DCPS complexes with components of pre-mRNA processing pathways including, spliceosomes, the transcription-export complex (TREX) and the nuclear pore complex (NUP). (D) Genes encoding DCPS-interacting proteins were found essential for AML survival in CRISPR-Cas9 screens. The Y-axis shows the lowest FDR q-value of each gene among 4 dropout screens (GeCKO library A and B screens in CALM/AF10 or MLL/AF9 cells); the X-axis indicates log2 ratio of normalized protein abundance between anti-DCPS antibody and control Ig IPs. See also Figure S4 and Table S4.
Figure 4
Figure 4. DCPS inhibition impedes pre-mRNA processing pathways in AML cells
(A) RNA-Seq analysis of effects of DCPS inhibition on pre-mRNA splicing and transcriptome activity. RNA samples were prepared prior to and 6 hr and 10 hr after RG3039 treatment of CALM/AF10 mouse leukemia cells or GMPs. (B) Event counts and ratios relative to control of indicated splicing patterns (10 hr after RG3039 treatment) are shown. Data are represented as means ± SD. (C) Venn diagrams show overlap of mis-spliced genes between CALM/AF10 AML cells and GMPs. (D) Waterfall plots indicate NMD-sensitivities and expression changes of genes aberrantly-spliced following RG3039 treatment. (E) Locations of Mis-splicing events. (F) GSEA analysis of RG3039-treated AML cells. See also Table S5.
Figure 5
Figure 5. DCPS is dispensable for steady-state hematopoiesis in humans
(A) Schematic representations of xenotransplant experiments. BM cells of mice treated with DMSO (vehicle) or RG3039 were transferred to secondary recipients to assess capacity to reconstitute human hematopoiesis. BRGS mice (Yamauchi et al., 2013) were used as recipients. (B) Proportions of human CD45+ cells were assessed by FACS on indicated days after the first transplant. 6 mice per condition were analyzed at each time point. (C) Dot graphs show proportions and numbers of hCD45+ cells in BM after first transplant. n.s.: not significant. Data are represented as means ± SD (n=6 per condition). (D) Bar graphs show proportions of B cells (hCD19+), T cells (hCD3+) and myeloid cells (hCD33+) in BM (n=6 per condition). Myeloid compartments were further defined using the myelo/monocytic markers CD11b, CD14 and CD15. Data are represented as means ± SD. P values were calculated using an unpaired t-test with Welch’s correction. (E) Bar graphs show proportions of hematopoietic stem cells (HSCs: CD34+CD38) and progenitors (CD34+CD38+) in BM. Data are represented as means ± SD (n=6 per condition). (F) Schematic representations of the germline loss-of-function mutation observed in a Jordanian family (Ng et al., 2015). Thymine (red) near the splice donor site downstream of exon 1 was mutated to cytosine, creating an alternative cryptic splice site (blue) and resulting in an in-frame premature termination 40bp downstream exon 1. (G) Family tree of the affected pedigree. Asterisks denote individuals whose peripheral blood counts were assessed in this study. (H) Peripheral blood counts of affected individuals and unaffected relatives are shown. See also Figure S5.
Figure 6
Figure 6. Treatment with a DCPS inhibitor has anti-leukemia effects in AML PDX models
(A) Workflow of PDX experiments. (B) Proportions of hCD45+ cells in PB were examined by FACS. Duration of RG3039 treatment (20 mg/kg for 14 days) is depicted in grey. Data are represented as means ± SD (n=4-5). (C) Mice were euthanized after RG3039 treatment, and BM leukemia burden was assessed by FACS. Dot graphs show proportions of hCD45+ cells in BM. Data are represented as means ± SD (n=3-5). P values were calculated using an unpaired t-test with Welch’s correction. (D) Survival curves (n=5 per group). Duration of RG3039 treatment (20 mg/kg for 14 days) is depicted in grey. P values were calculated using a Mantel-Cox log-rank test. See also Figure S6.

Comment in

  • Targeting mRNA Decapping in AML.
    Yoshimi A, Abdel-Wahab O. Yoshimi A, et al. Cancer Cell. 2018 Mar 12;33(3):339-341. doi: 10.1016/j.ccell.2018.02.015. Cancer Cell. 2018. PMID: 29533777 Free PMC article.

References

    1. Abifadel M, Varret M, Rabès J-P, Allard D, Ouguerram K, Devillers M, Cruaud C, Benjannet S, Wickham L, Erlich D, et al. Mutations in PCSK9 cause autosomal dominant hypercholesterolemia. Nat Genet. 2003;34:154–156. - PubMed
    1. Ahmed I, Buchert R, Zhou M, Jiao X, Mittal K, Sheikh TI, Scheller U, Vasli N, Rafiq MA, Brohi MQ, et al. Mutations in DCPS and EDC3 in autosomal recessive intellectual disability indicate a crucial role for mRNA decapping in neurodevelopment. Hum Mol Genet. 2015;24:3172–3180. - PMC - PubMed
    1. Alexandrov LB, Nik-Zainal S, Wedge DC, Aparicio SAJR, Behjati S, Biankin AV, Bignell GR, Bolli N, Borg A, Børresen Dale A-L, et al. Signatures of mutational processes in human cancer. Nature. 2013;500:415–421. - PMC - PubMed
    1. Andersen PR, Domanski M, Kristiansen MS, Storvall H, Ntini E, Verheggen C, Schein A, Bunkenborg J, Poser I, Hallais M, et al. The human cap-binding complex is functionally connected to the nuclear RNA exosome. Nat Struct Mol Biol. 2013;20:1367–1376. - PMC - PubMed
    1. Boehm JS, Hahn WC. Towards systematic functional characterization of cancer genomes. Nat Rev Genet. 2011;12:487–498. - PubMed

Publication types

MeSH terms

Substances