

ZnO nanoparticle preparation route influences surface reactivity, dissolution and cytotoxicity
- PMID: 29479436
- PMCID: PMC5823520
- DOI: 10.1039/C7EN00888K
ZnO nanoparticle preparation route influences surface reactivity, dissolution and cytotoxicity
Abstract
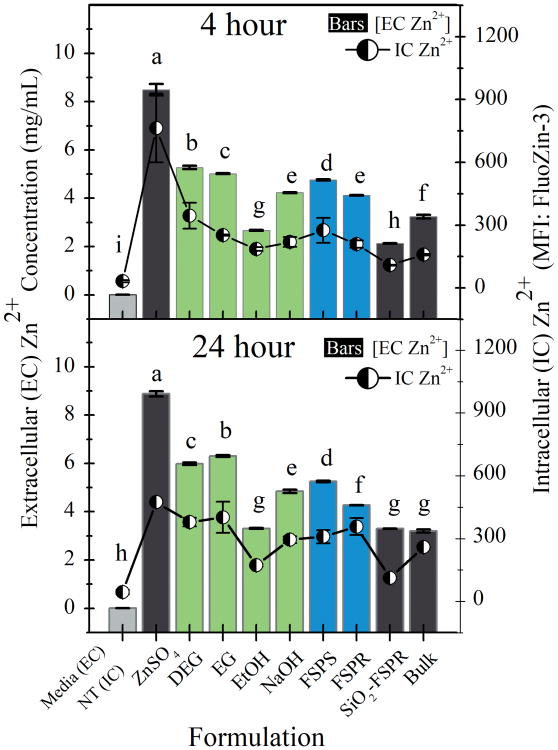
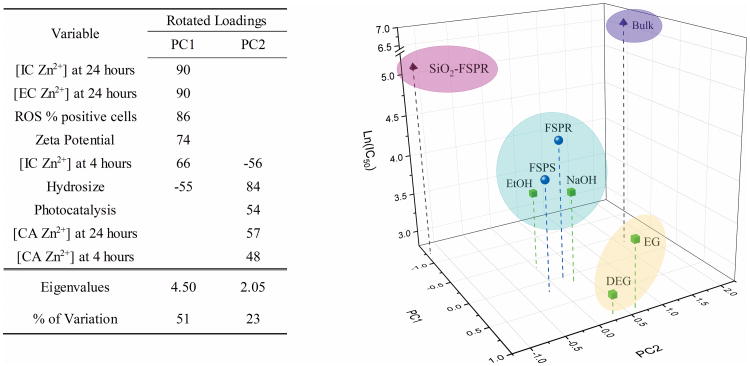
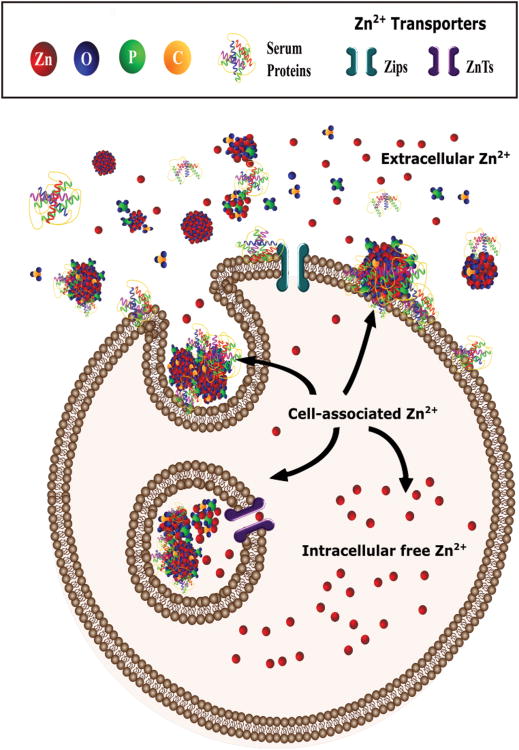
ZnO nanoparticles (nZnO) are commonly used in nanotechnology applications despite their demonstrated cytotoxicity against multiple cell types. This underscores the significant need to determine the physicochemical properties that influence nZnO cytotoxicity. In this study, we analyzed six similarly sized nZnO formulations, along with SiO2-coated nZnO, bulk ZnO and ZnSO4 as controls. Four of the nZnO samples were synthesized using various wet chemical methods, while three employed high-temperature flame spray pyrolysis (FSP) techniques. X-ray diffraction and optical analysis demonstrated the lattice parameters and electron band gap of the seven nZnO formulations were similar. However, electrophoretic mobility measures, hydrodynamic size, photocatalytic rate constants, dissolution potential, reactive oxygen species (ROS) production and, more importantly, the cytotoxicity of the variously synthesized nZnO towards Jurkat leukemic and primary CD4+ T cells displayed major differences. Surface structure analysis using FTIR, X-ray photoelectron spectroscopies (XPS) and dynamic light scattering (DLS) revealed significant differences in the surface-bound chemical groups and the agglomeration tendencies of the samples. The wet chemical nZnO, with higher cationic surface charge, faster photocatalytic rates, increased extracellular dissolution and ROS generation demonstrated greater cytotoxicity towards both cell types than those made with FSP techniques. Furthermore, principal component analysis (PCA) suggests that the synthesis procedure employed influences which physicochemical properties contribute more to the cytotoxic response. These results suggest that the synthesis approach results in unique surface chemistries and can be a determinant of cellular cytotoxicity and oxidative stress responses.
Conflict of interest statement
Conflicts of interest: There are no conflicts to declare.
Figures


Similar articles
-
Serum Proteins Enhance Dispersion Stability and Influence the Cytotoxicity and Dosimetry of ZnO Nanoparticles in Suspension and Adherent Cancer Cell Models.Nanoscale Res Lett. 2015 Dec;10(1):448. doi: 10.1186/s11671-015-1158-y. Epub 2015 Nov 17. Nanoscale Res Lett. 2015. PMID: 26577392 Free PMC article.
-
Rapid Dissolution of ZnO Nanoparticles Induced by Biological Buffers Significantly Impacts Cytotoxicity.Chem Res Toxicol. 2017 Aug 21;30(8):1641-1651. doi: 10.1021/acs.chemrestox.7b00136. Epub 2017 Aug 11. Chem Res Toxicol. 2017. PMID: 28693316 Free PMC article.
-
Cytotoxicity of ZnO Nanoparticles Can Be Tailored by Modifying Their Surface Structure: A Green Chemistry Approach for Safer Nanomaterials.ACS Sustain Chem Eng. 2014 Jul 7;2(7):1666-1673. doi: 10.1021/sc500140x. Epub 2014 May 19. ACS Sustain Chem Eng. 2014. PMID: 25068096 Free PMC article.
-
Photocatalytic Behaviour of Zinc Oxide Nanostructures on Surface Activation of Polymeric Fibres.Polymers (Basel). 2021 Apr 10;13(8):1227. doi: 10.3390/polym13081227. Polymers (Basel). 2021. PMID: 33920272 Free PMC article. Review.
-
Zinc oxide nanoparticles: Synthesis, antiseptic activity and toxicity mechanism.Adv Colloid Interface Sci. 2017 Nov;249:37-52. doi: 10.1016/j.cis.2017.07.033. Epub 2017 Aug 26. Adv Colloid Interface Sci. 2017. PMID: 28923702 Review.
Cited by
-
Zinc-Acetate-Amine Complexes as Precursors to ZnO and the Effect of the Amine on Nanoparticle Morphology, Size, and Photocatalytic Activity.Catalysts. 2022 Oct;12(10):1099. doi: 10.3390/catal12101099. Epub 2022 Sep 23. Catalysts. 2022. PMID: 36405766 Free PMC article.
-
Defect Engineering of ZnO Nanoparticles for Bioimaging Applications.ACS Appl Mater Interfaces. 2019 Jul 17;11(28):24933-24944. doi: 10.1021/acsami.9b01582. Epub 2019 Jul 3. ACS Appl Mater Interfaces. 2019. PMID: 31173687 Free PMC article.
-
Multilayered composite coatings of titanium dioxide nanotubes decorated with zinc oxide and hydroxyapatite nanoparticles: controlled release of Zn and antimicrobial properties against Staphylococcus aureus.Int J Nanomedicine. 2019 May 16;14:3583-3600. doi: 10.2147/IJN.S199219. eCollection 2019. Int J Nanomedicine. 2019. PMID: 31190813 Free PMC article.
-
ZnO nanocrystals derived from organometallic approach: Delineating the role of organic ligand shell on physicochemical properties and nano-specific toxicity.Sci Rep. 2019 Dec 2;9(1):18071. doi: 10.1038/s41598-019-54509-z. Sci Rep. 2019. PMID: 31792318 Free PMC article.
-
A Method to Assess the Relevance of Nanomaterial Dissolution During Reactivity Testing.Materials (Basel). 2020 May 13;13(10):2235. doi: 10.3390/ma13102235. Materials (Basel). 2020. PMID: 32414026 Free PMC article.
References
-
- Zvyagin V, Zhao X, Gierden A, Sanchez W, Ross JA, Roberts MS. Journal of biomedical optics. 2008;13:0640311–0640319. - PubMed
-
- Becheri A, Durr M, Lo Nostro P, Baglioni P. Journal of Nanoparticle Research. 2008;10:679–689.
-
- Smijs TGM, Bouwstra JA. Journal of Biomedical Nanotechnology. 2010;6:469–484. - PubMed
Grants and funding
LinkOut - more resources
Full Text Sources
Other Literature Sources
Research Materials
Miscellaneous