

How has our knowledge of dinosaur diversity through geologic time changed through research history?
- PMID: 29479504
- PMCID: PMC5822849
- DOI: 10.7717/peerj.4417
How has our knowledge of dinosaur diversity through geologic time changed through research history?
Abstract
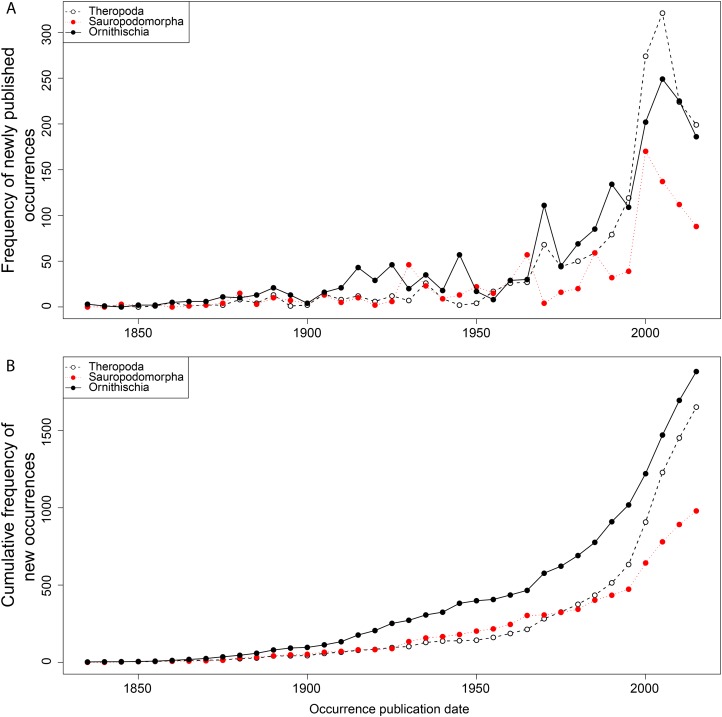
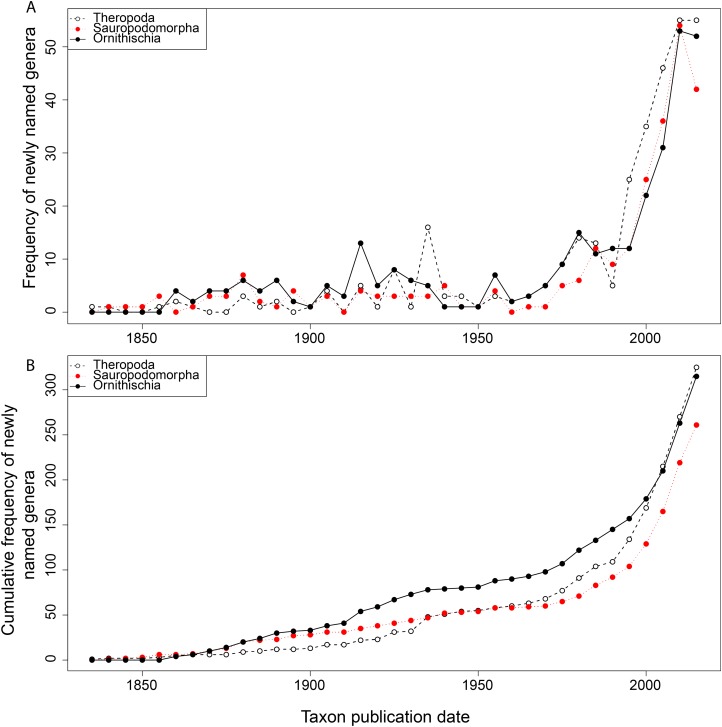
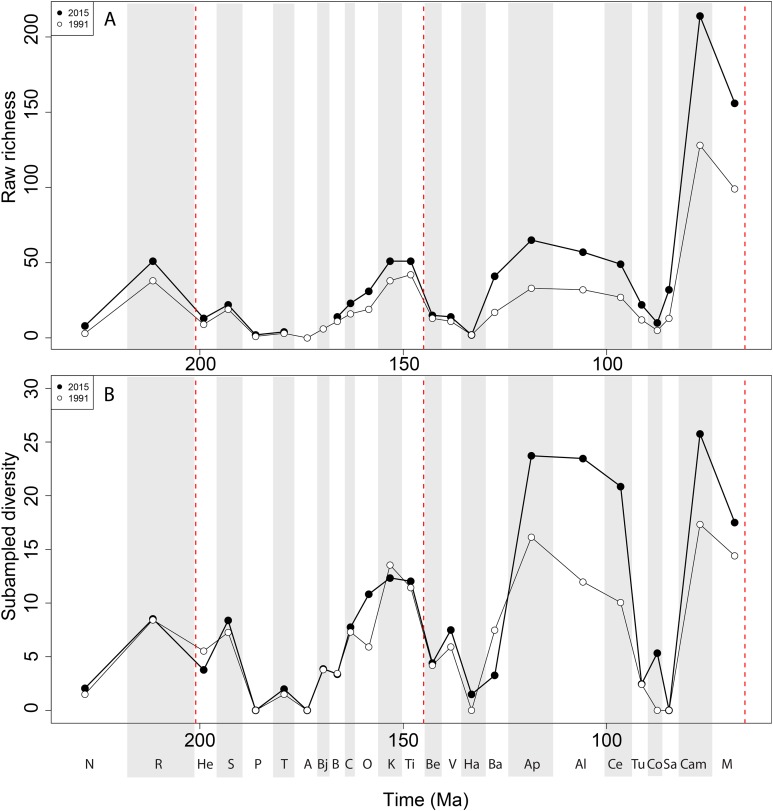
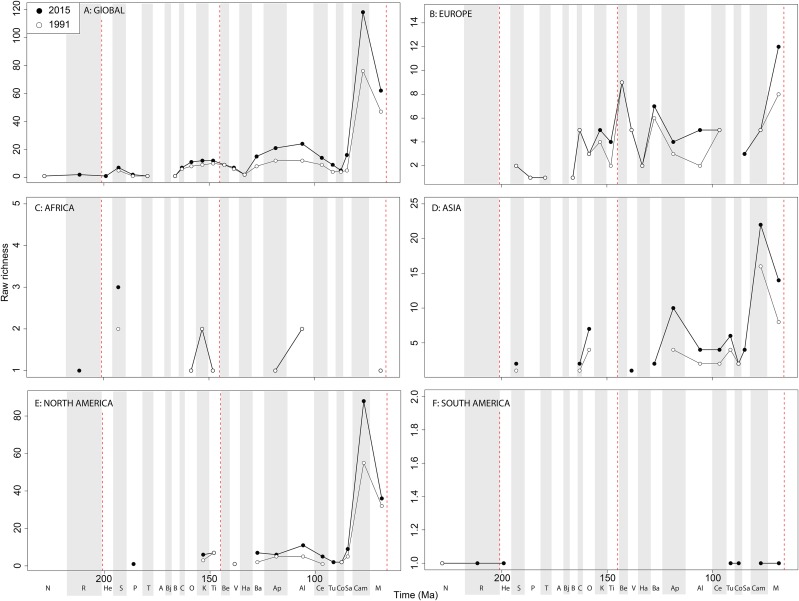
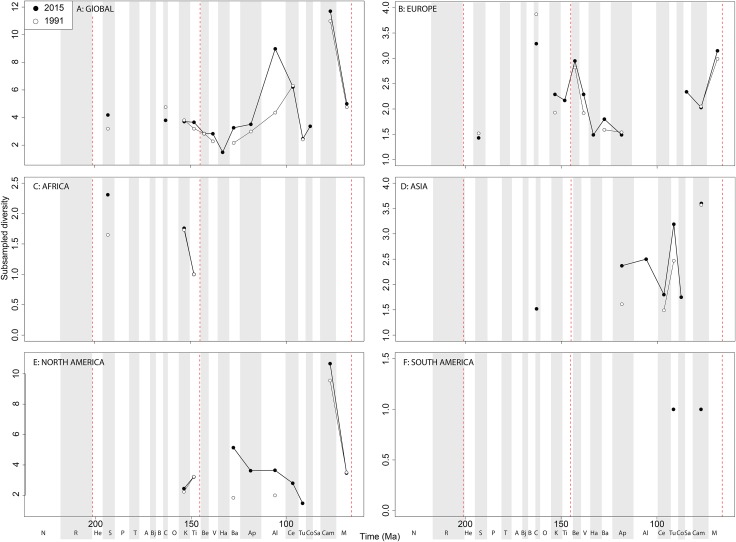
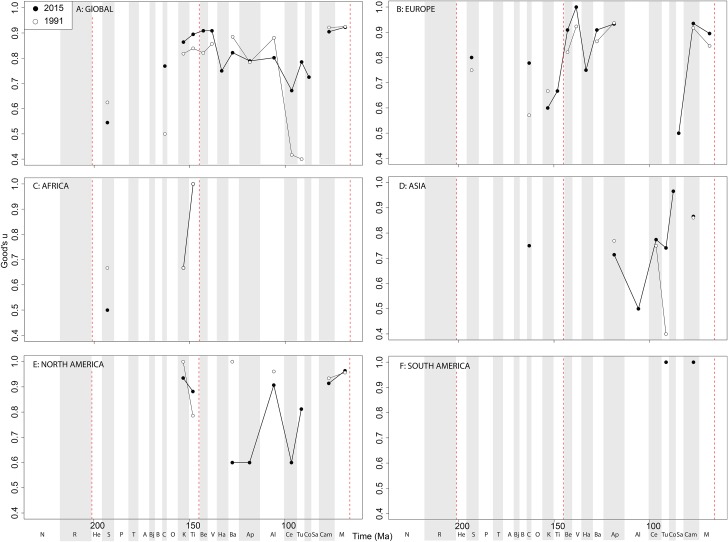
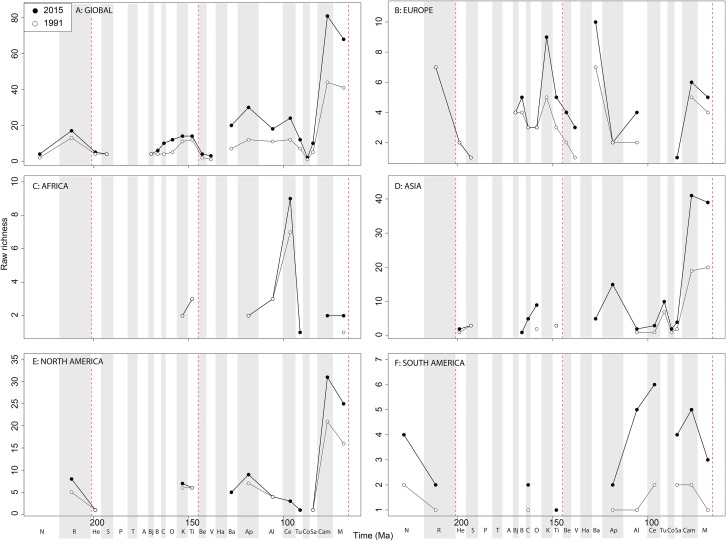
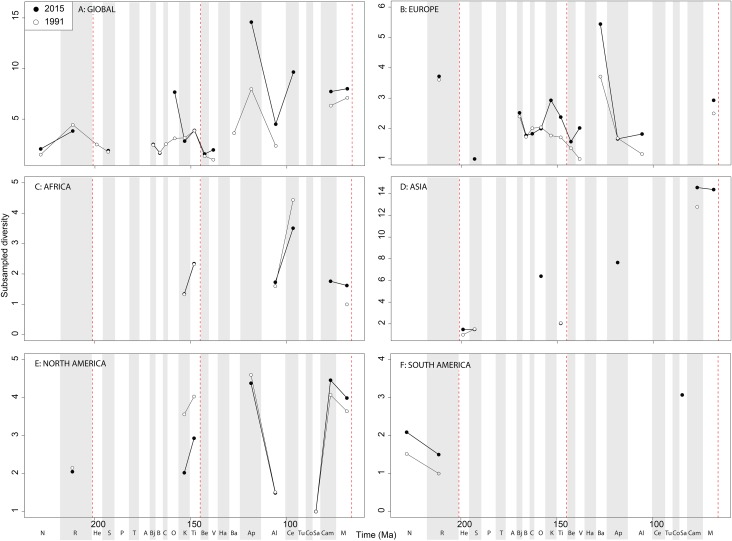
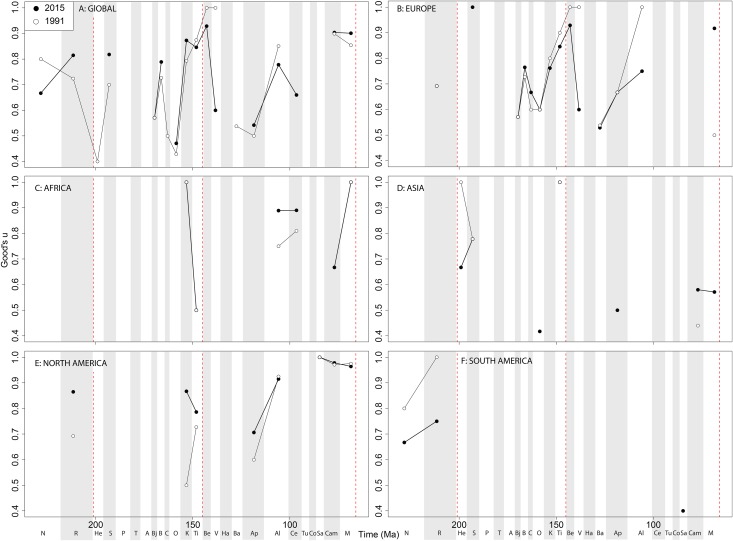
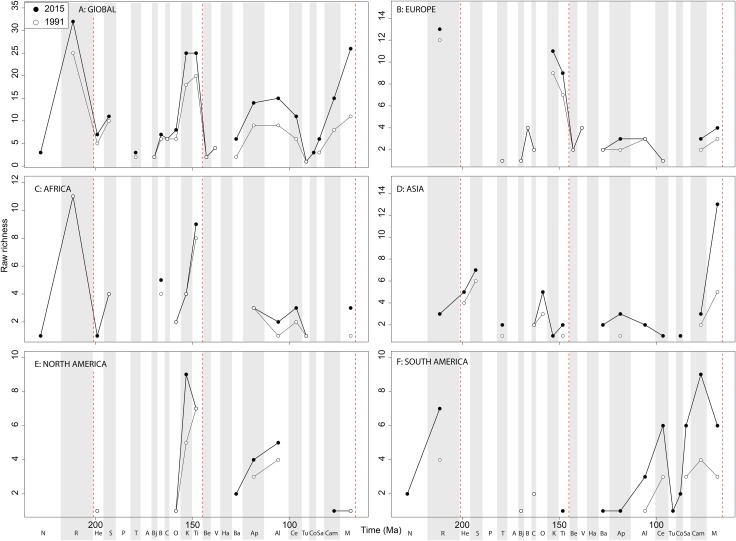
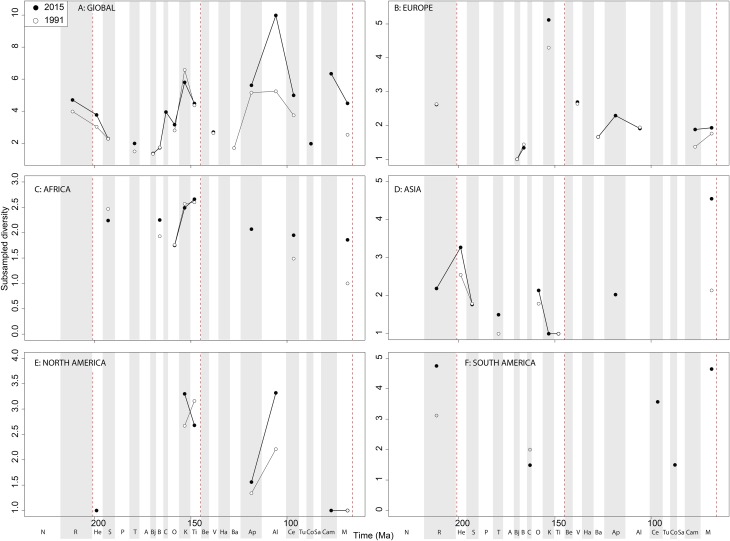
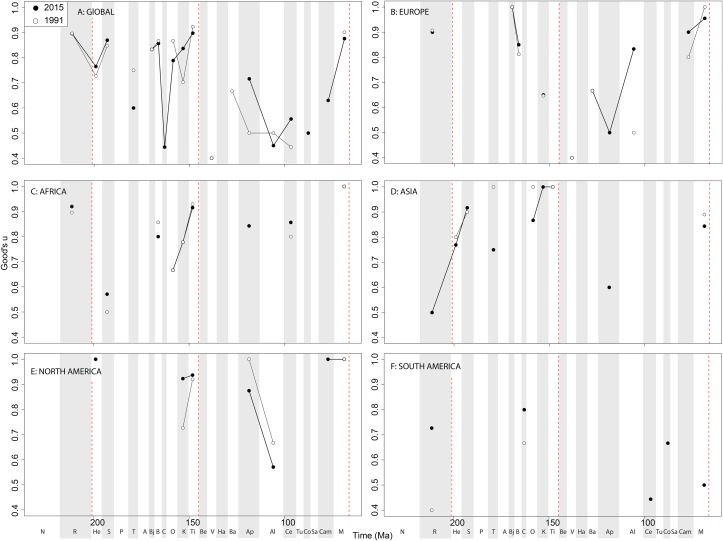
Assessments of dinosaur macroevolution at any given time can be biased by the historical publication record. Recent studies have analysed patterns in dinosaur diversity that are based on secular variations in the numbers of published taxa. Many of these have employed a range of approaches that account for changes in the shape of the taxonomic abundance curve, which are largely dependent on databases compiled from the primary published literature. However, how these 'corrected' diversity patterns are influenced by the history of publication remains largely unknown. Here, we investigate the influence of publication history between 1991 and 2015 on our understanding of dinosaur evolution using raw diversity estimates and shareholder quorum subsampling for the three major subgroups: Ornithischia, Sauropodomorpha, and Theropoda. We find that, while sampling generally improves through time, there remain periods and regions in dinosaur evolutionary history where diversity estimates are highly volatile (e.g. the latest Jurassic of Europe, the mid-Cretaceous of North America, and the Late Cretaceous of South America). Our results show that historical changes in database compilation can often substantially influence our interpretations of dinosaur diversity. 'Global' estimates of diversity based on the fossil record are often also based on incomplete, and distinct regional signals, each subject to their own sampling history. Changes in the record of taxon abundance distribution, either through discovery of new taxa or addition of existing taxa to improve sampling evenness, are important in improving the reliability of our interpretations of dinosaur diversity. Furthermore, the number of occurrences and newly identified dinosaurs is still rapidly increasing through time, suggesting that it is entirely possible for much of what we know about dinosaurs at the present to change within the next 20 years.
Keywords: Cretaceous; Dinosaurs; Diversity; Extinction; Jurassic; Macroevolution; Mesozoic; Paleobiology Database; Publication bias; Triassic.
Conflict of interest statement
The authors declare that they have no competing interests.
Figures
Similar articles
-
The origin and early evolution of dinosaurs.Biol Rev Camb Philos Soc. 2010 Feb;85(1):55-110. doi: 10.1111/j.1469-185X.2009.00094.x. Epub 2009 Nov 6. Biol Rev Camb Philos Soc. 2010. PMID: 19895605 Review.
-
Testing the effect of the rock record on diversity: a multidisciplinary approach to elucidating the generic richness of sauropodomorph dinosaurs through time.Biol Rev Camb Philos Soc. 2011 Feb;86(1):157-81. doi: 10.1111/j.1469-185X.2010.00139.x. Biol Rev Camb Philos Soc. 2011. PMID: 20412186
-
Dinosaur diversity and the rock record.Proc Biol Sci. 2009 Jul 22;276(1667):2667-74. doi: 10.1098/rspb.2009.0352. Epub 2009 Apr 29. Proc Biol Sci. 2009. PMID: 19403535 Free PMC article.
-
A palaeoequatorial ornithischian and new constraints on early dinosaur diversification.Proc Biol Sci. 2014 Sep 22;281(1791):20141147. doi: 10.1098/rspb.2014.1147. Proc Biol Sci. 2014. PMID: 25100698 Free PMC article.
-
Testing co-evolutionary hypotheses over geological timescales: interactions between Mesozoic non-avian dinosaurs and cycads.Biol Rev Camb Philos Soc. 2009 Feb;84(1):73-89. doi: 10.1111/j.1469-185X.2008.00065.x. Epub 2008 Dec 19. Biol Rev Camb Philos Soc. 2009. PMID: 19133960 Review.
Cited by
-
Xenoposeidon is the earliest known rebbachisaurid sauropod dinosaur.PeerJ. 2018 Jul 6;6:e5212. doi: 10.7717/peerj.5212. eCollection 2018. PeerJ. 2018. PMID: 30002991 Free PMC article.
-
The macroecology of Mesozoic dinosaurs.Biol Lett. 2024 Nov;20(11):20240392. doi: 10.1098/rsbl.2024.0392. Epub 2024 Nov 13. Biol Lett. 2024. PMID: 39535111 Free PMC article. Review.
-
Taxonomic identification bias does not drive patterns of abundance and diversity in theropod dinosaurs.Biol Lett. 2021 Jul;17(7):20210168. doi: 10.1098/rsbl.2021.0168. Epub 2021 Jul 14. Biol Lett. 2021. PMID: 34256583 Free PMC article.
-
Late Jurassic theropod dinosaur bones from the Langenberg Quarry (Lower Saxony, Germany) provide evidence for several theropod lineages in the central European archipelago.PeerJ. 2020 Feb 6;8:e8437. doi: 10.7717/peerj.8437. eCollection 2020. PeerJ. 2020. PMID: 32071804 Free PMC article.
-
The phylogenetic nomenclature of ornithischian dinosaurs.PeerJ. 2021 Dec 9;9:e12362. doi: 10.7717/peerj.12362. eCollection 2021. PeerJ. 2021. PMID: 34966571 Free PMC article.
References
-
- Alroy J. Fair sampling of taxonomic richness and unbiased estimation of origination and extinction rates. In: Alroy J, Hunt G, editors. Quantitative Methods in Paleobiology. Boulder: The Paleontological Society; 2010a. pp. 55–80.
-
- Alroy J. Geographical, environmental and intrinsic biotic controls on Phanerozoic marine diversification. Palaeontology. 2010b;53(6):1211–1235. doi: 10.1111/j.1475-4983.2010.01011.x. - DOI
LinkOut - more resources
Full Text Sources
Other Literature Sources
