

Relationship Between Fibrosis Detected on Late Gadolinium-Enhanced Cardiac Magnetic Resonance and Re-Entrant Activity Assessed With Electrocardiographic Imaging in Human Persistent Atrial Fibrillation
- PMID: 29479568
- PMCID: PMC5824731
- DOI: 10.1016/j.jacep.2017.07.019
Relationship Between Fibrosis Detected on Late Gadolinium-Enhanced Cardiac Magnetic Resonance and Re-Entrant Activity Assessed With Electrocardiographic Imaging in Human Persistent Atrial Fibrillation
Abstract
Objectives: This study sought to assess the relationship between fibrosis and re-entrant activity in persistent atrial fibrillation (AF).
Background: The mechanisms involved in sustaining re-entrant activity during AF are poorly understood.
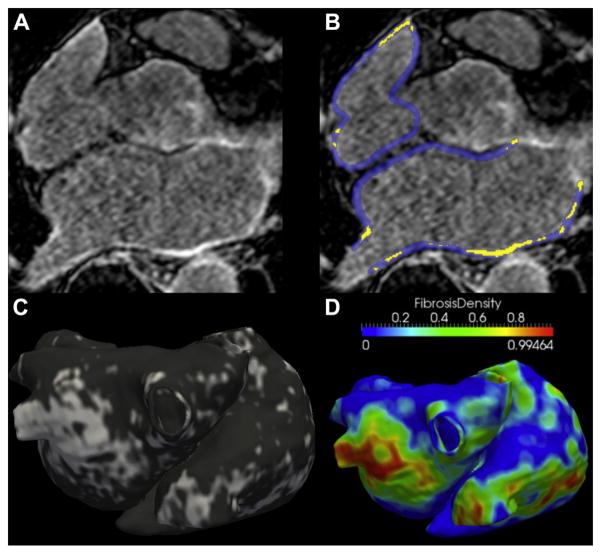
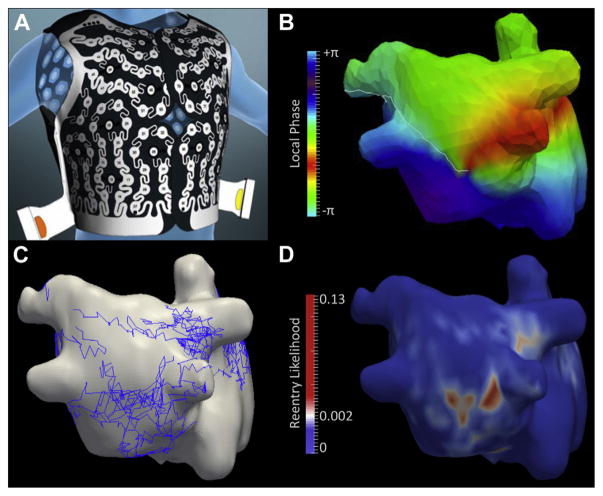
Methods: Forty-one patients with persistent AF (age 56 ± 12 years; 6 women) were evaluated. High-resolution electrocardiographic imaging (ECGI) was performed during AF by using a 252-chest electrode array, and phase mapping was applied to locate re-entrant activity. Sites of high re-entrant activity were defined as re-entrant regions. Late gadolinium-enhanced (LGE) cardiac magnetic resonance (CMR) was performed at 1.25 × 1.25 × 2.5 mm resolution to characterize atrial fibrosis and measure atrial volumes. The relationship between LGE burden and the number of re-entrant regions was analyzed. Local LGE density was computed and characterized at re-entrant sites. All patients underwent catheter ablation targeting re-entrant regions, the procedural endpoint being AF termination. Clinical, CMR, and ECGI predictors of acute procedural success were then analyzed.
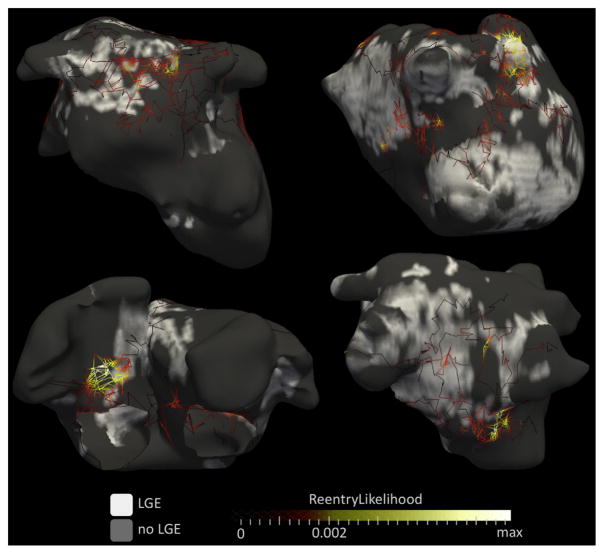
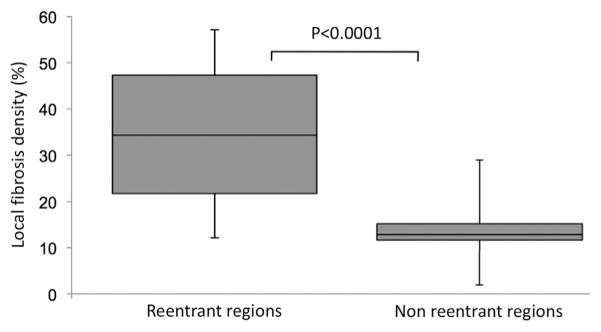
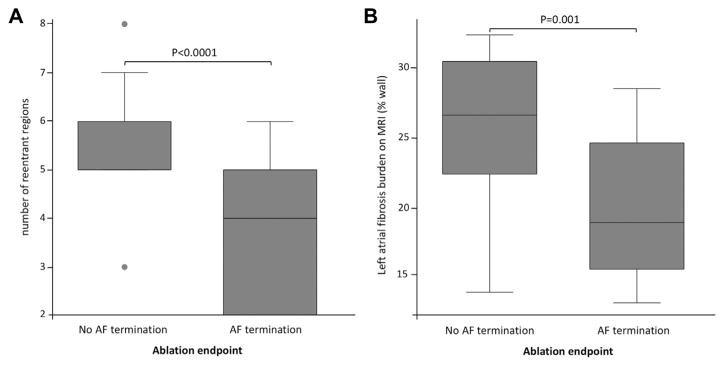
Results: Left atrial (LA) LGE burden was 22.1 ± 5.9% of the wall, and LA volume was 74 ± 21 ml/m2. The number of re-entrant regions was 4.3 ± 1.7 per patient. LA LGE imaging was significantly associated with the number of re-entrant regions (R = 0.52, p = 0.001), LA volume (R = 0.62, p < 0.0001), and AF duration (R = 0.54, p = 0.0007). Regional analysis demonstrated a clustering of re-entrant activity at LGE borders. Areas with high re-entrant activity showed higher local LGE density as compared with the remaining atrial areas (p < 0.0001). Failure to achieve AF termination during ablation was associated with higher LA LGE burden (p < 0.001), higher number of re-entrant regions (p < 0.001), and longer AF duration (p = 0.008).
Conclusions: The number of re-entrant regions during AF relates to the extent of LGE on CMR, with the location of these regions clustering to LGE areas. These characteristics affect procedural outcomes of ablation.
Keywords: atrial fibrillation; atrial fibrosis; electrocardiographic mapping; magnetic resonance imaging; re-entry; rotor.
Figures
Comment in
-
A Secret Marriage Between Fibrosis and Atrial Fibrillation Drivers.JACC Clin Electrophysiol. 2018 Jan;4(1):30-32. doi: 10.1016/j.jacep.2017.09.176. Epub 2017 Nov 29. JACC Clin Electrophysiol. 2018. PMID: 29600783 No abstract available.
Similar articles
-
Lack of regional association between atrial late gadolinium enhancement on cardiac magnetic resonance and atrial fibrillation rotors.Heart Rhythm. 2016 Mar;13(3):654-60. doi: 10.1016/j.hrthm.2015.11.011. Epub 2015 Nov 10. Heart Rhythm. 2016. PMID: 26569460
-
Clinical predictors of cardiac magnetic resonance late gadolinium enhancement in patients with atrial fibrillation.Europace. 2017 Mar 1;19(3):371-377. doi: 10.1093/europace/euw019. Europace. 2017. PMID: 26965439 Free PMC article.
-
Sinus rhythm restores ventricular function in patients with cardiomyopathy and no late gadolinium enhancement on cardiac magnetic resonance imaging who undergo catheter ablation for atrial fibrillation.Heart Rhythm. 2013 Sep;10(9):1334-9. doi: 10.1016/j.hrthm.2013.06.019. Epub 2013 Jun 27. Heart Rhythm. 2013. PMID: 23811081
-
New Insights Into the Use of Cardiac Magnetic Resonance Imaging to Guide Decision Making in Atrial Fibrillation Management.Can J Cardiol. 2018 Nov;34(11):1461-1470. doi: 10.1016/j.cjca.2018.07.007. Epub 2018 Jul 12. Can J Cardiol. 2018. PMID: 30297256 Review.
-
Assessment of Left Atrial Fibrosis by Late Gadolinium Enhancement Magnetic Resonance Imaging: Methodology and Clinical Implications.JACC Clin Electrophysiol. 2017 Aug;3(8):791-802. doi: 10.1016/j.jacep.2017.07.004. Epub 2017 Aug 21. JACC Clin Electrophysiol. 2017. PMID: 29759774 Review.
Cited by
-
High-density mapping of the average complex interval helps localizing atrial fibrillation drivers and predicts catheter ablation outcomes.Front Cardiovasc Med. 2023 Aug 17;10:1145894. doi: 10.3389/fcvm.2023.1145894. eCollection 2023. Front Cardiovasc Med. 2023. PMID: 37663412 Free PMC article.
-
The role of personalized atrial modeling in understanding atrial fibrillation mechanisms and improving treatment.Int J Cardiol. 2019 Jul 15;287:139-147. doi: 10.1016/j.ijcard.2019.01.096. Epub 2019 Jan 31. Int J Cardiol. 2019. PMID: 30755334 Free PMC article. Review.
-
Sensitivity of reentrant driver localization to electrophysiological parameter variability in image-based computational models of persistent atrial fibrillation sustained by a fibrotic substrate.Chaos. 2017 Sep;27(9):093932. doi: 10.1063/1.5003340. Chaos. 2017. PMID: 28964164 Free PMC article.
-
Addressing challenges of quantitative methodologies and event interpretation in the study of atrial fibrillation.Comput Methods Programs Biomed. 2019 Sep;178:113-122. doi: 10.1016/j.cmpb.2019.06.017. Epub 2019 Jun 15. Comput Methods Programs Biomed. 2019. PMID: 31416540 Free PMC article. Review.
-
Computationally guided personalized targeted ablation of persistent atrial fibrillation.Nat Biomed Eng. 2019 Nov;3(11):870-879. doi: 10.1038/s41551-019-0437-9. Epub 2019 Aug 19. Nat Biomed Eng. 2019. PMID: 31427780 Free PMC article.
References
-
- Kannel WB, Abbott RD, Savage DD, et al. Epidemiologic features of chronic atrial fibrillation: the Framingham study. N Engl J Med. 1982;306:1018–22. - PubMed
-
- Mandapati R, Skanes A, Chen J, et al. Stable microreentrant sources as a mechanism of atrial fibrillation in the isolated sheep heart. Circulation. 2000;101:194–9. - PubMed
-
- Jalife J, Berenfeld O, Mansour M. Mother rotors and fibrillatory conduction: a mechanism of atrial fibrillation. Cardiovasc Res. 2002;54:204–16. - PubMed
-
- Haïssaguerre M, Hocini M, Sanders P, et al. Localized sources maintaining atrial fibrillation organized by prior ablation. Circulation. 2006;113:616–25. - PubMed
Publication types
MeSH terms
Substances
Grants and funding
LinkOut - more resources
Full Text Sources
Other Literature Sources
Medical