. 2018 Aug;24(8):721-733.
doi: 10.1111/cns.12830. Epub 2018 Feb 25.

Preferential modulation of the lateral habenula activity by serotonin-2A rather than -2C receptors: Electrophysiological and neuroanatomical evidence

Affiliations

Preferential modulation of the lateral habenula activity by serotonin-2A rather than -2C receptors: Electrophysiological and neuroanatomical evidence

Francis Delicata et al. CNS Neurosci Ther. 2018 Aug.

Abstract

Aims: Serotonergic (5-HT) modulation of the lateral habenula (LHb) activity is central in normal and pathologic conditions such as mood disorders. Among the multiple 5-HT receptors (5-HTRs) involved, the 5-HT2C R seems to play a pivotal role. Yet, the role of 5-HT2A Rs in the control of the LHb neuronal activity is completely unknown.

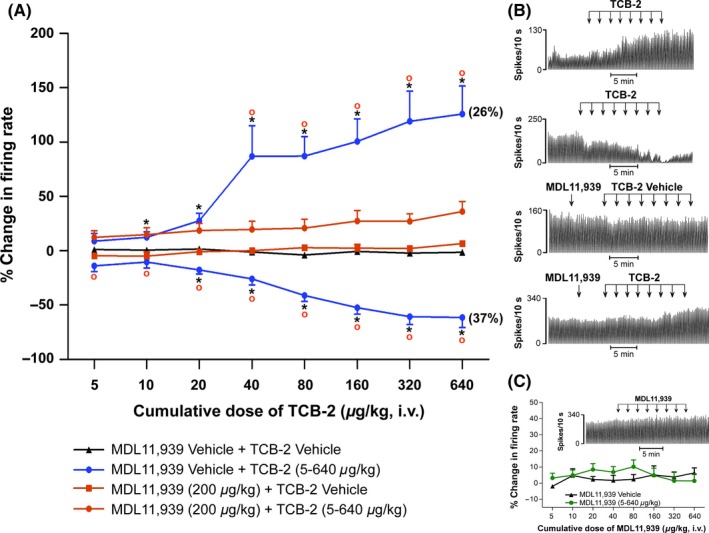
Methods: Single-cell extracellular recording of the LHb neurons was used in rats to study the effect of the general activation and blockade of the 5-HT2C R and 5-HT2A R with Ro 60-0175 and SB242084, TCB-2 and MDL11939, respectively. The expression of both receptors in the LHb was confirmed using immunohistochemistry.

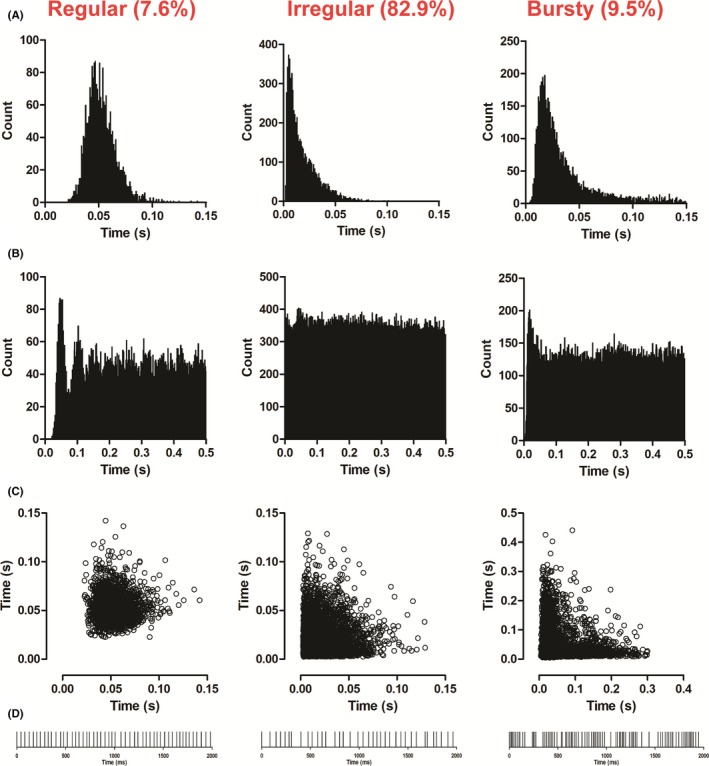
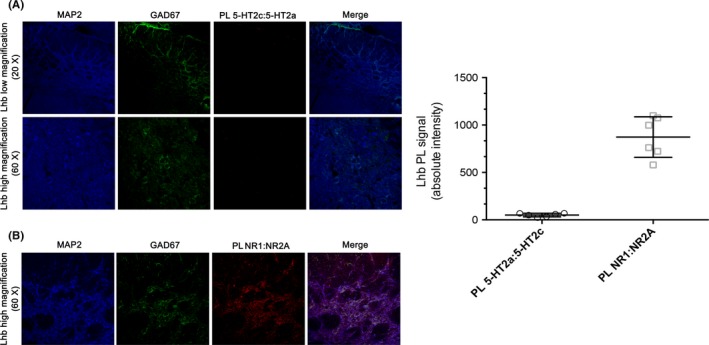
Results: Cumulative doses (5-640 μg/kg, iv) of Ro 60-0175 and TCB-2 affected the activity of 34% and 63% of the LHb recorded neurons, respectively. LHb neurons were either inhibited at low doses or excited at higher doses of the 5-HT2A/C R agonists. SB242084 or MDL11939 (both at 200 μg/kg, iv) did not modify neuronal firing when injected alone, but reverted the bidirectional effects of Ro 60-0175 or TCB-2, respectively. 5-HT2C Rs and 5-HT2A Rs are expressed in less than the 20% of the LHb neurons, and they neither colocalize nor make heterodimers. Strikingly, only 5-HT2A Rs are expressed by the majority of LHb astrocyte cells.

Conclusions: Peripheral administration of 5-HT2A R agonist promotes a heterogeneous pattern of neuronal responses in the LHb, and these effects are more prominent than those induced by the 5-HT2C R activation.

Keywords: addiction; depression; immunohistochemistry; lateral habenula; serotonin.


Conflict of interest statement

The authors declare that the research was conducted in the absence of any commercial or financial relationships that could be construed as a potential conflict of interest.

Figures

Figure 1
Figure 1
Firing pattern of recorded LHb neurons. The firing pattern of LHb neurons was classified as either regular, irregular or bursty, according to their interspike interval histograms (A), autocorrelorgrams (B) and scattergrams (C). Regular firing neurons were characterized by a narrow bell‐shaped distribution of the interspike intervals histogram, multiple initial peaks in the autocorrelogram, and a well‐defined cluster in the scattergrams. Neurons displaying an irregular firing pattern typically showed a skewed Poisson‐like distribution in their interspike interval histograms, a flat distribution with no peaks in the autocorrelograms and a dispersed cluster in the scattergrams. Finally, bursty firing neurons showed interspike interval histograms with a bimodal or very skewed distribution with a long tail, autocorrelograms with an initial narrow peak and a scattergram with a “L”‐shaped distribution along the 2 main axis. The raster plots (D) show the differences between the 3 patterns of firing, in which the interspike intervals were more constant in regular firing neurons, more erratic in irregular firing neurons, and clumped with periods of silence in bursty firing neurons. In the figure, interspike interval histograms, autocorrelograms, and scattergrams of representative neurons of each firing patterns are shown
Figure 2
Figure 2
Effect of the systemic administration of the 5‐HT2C R agonist Ro 60‐0175 and 5‐HT2CR antagonist SB242084 on LHb neuronal firing. (A) Dose–response curve of Ro 60‐0175 (5‐640 μg/kg, iv) showing the mean % change in firing rate ± SEM. About 10% of recorded neurons responded with an increase in firing rate, 24% with a decrease, while 66% showed no overall change in their firing frequency (not shown). One‐way ANOVA for repeated‐measures followed by Tukey's post hoc test, *P < 0.05 vs Vehicle. (B) Representative rate histograms obtained from single neurons showing 2 of the 3 different neuronal responses observed: excitation (top), inhibition (bottom), and a control neuron (middle). (C) Dose–response curve of SB242084 (5‐640 μg/kg, iv) showing the mean % change in firing rate ± SEM. Neurons showed no overall change compared to their basal firing activity (shown in green). A representative rate histogram of a recorded neuron is shown in the inset. (D) The involvement of the 5‐HT2CRs in mediating Ro 60‐0175‐induced changes in LHb neuronal activity was confirmed through a single administration of SB242084 (200 μg/kg, iv) 2 min after the last dose of Ro 60‐0175. SB242084, a selective 5‐HT2CR antagonist, was capable of reversing Ro 60‐0175‐induced changes in firing rate. iv: intravenous; predrug: the 2‐min period before the administration of the first dose of Ro 60‐0175; Ro 60‐0175: the 2‐min period following the administration of the last dose of Ro 60‐0175; SB242084: the 2‐min period following SB242084 administration. (E) Representative rate histograms showing SB242084‐induced reversal of both excitation (top) and inhibition (bottom) responses in firing rate induced by Ro 60‐0175. Paired t‐test, § P < 0.05 predrug vs Ro 60‐0175, P < 0.05 Ro 60‐0175 vs SB242084. The inset shows a microphotograph of a rat brain coronal section containing the neuron recorded on the right and the corresponding section taken from the atlas of Paxinos and Watson (2017). FR: fasciculus retroflexus; LHbL: lateral portion of the lateral habenula; LHbM: medial portion of the lateral habenula; MHb: medial habenula; SM: stria medularis
Figure 3
Figure 3
Effect of the systemic administration of the 5‐HT2AR agonist TCB‐2 and 5‐HT2AR antagonist MDL11939 on LHb neuronal firing. (A) Dose–response curves of TCB‐2 (5‐640 μg/kg, iv) showing the mean % change in firing rate ± SEM (in blue). About 26% of recorded neurons increased, 37% decreased and 37% did not change (not shown) their baseline firing rates in response to TCB‐2 administration. The role of the 5‐HT2AR in mediating TCB‐2 induced changes in LHb neuronal activity was confirmed through the pretreatment with MDL11939 (200 μg/kg, iv, in orange). MDL11939 pretreatment blocked TCB‐2 induced changes in firing rate, which accounted for 63% of neurons when TCB‐2 was administered on its own. One‐way ANOVA for repeated measures followed by Tukey's post hoc test, * P < 0.05 vs Vehicle, ° P < 0.05 vs MDL11939+ TCB‐2. (B) Representative rate histograms obtained from single LHb neurons, showing TCB‐2 induced excitation/inhibition (top 2 traces, respectively) of neuronal activity, the lack of effect of MDL11939 pretreatment (third trace) and the effect of MDL11939 pretreatment on TCB‐2 administration (fourth trace). (C) Dose–response curve of MDL11939 (5‐640 μg/kg, iv) showing the mean % change in firing rate ± SEM. The neurons showed no overall significant change in firing rate (in green) when compared to its vehicle (in black). The inset shows a rate histogram illustrating the neuronal response of a single LHb cell to MDL11939 (5‐640 μg/kg, iv) administration
Figure 4
Figure 4
Brightfield photomicrographs of 5‐HT2AR‐ and 5‐HT2CR‐ immunoreactivity in the rat LHb. Brightfield photomicrographs of coronal sections (A‐D) and histogram (E, F) showing the distribution of 5‐HT2ARs (A, B) and 5‐HT2CRs (C, D) immunoreactivity in the rat LHb. The density of immunostained neurons, as well as the intensity of neuropilar immunoreactivity, was similar compared to the immunostaining obtained for these 2 receptors. Scale bar = 200 μm in C (applies to A and C); 20 μm in D (applies to B and D)
Figure 5
Figure 5
Photomicrographs of the colocalization of 5‐HT2AR/HuC/D, 5‐HT2CR/PGP 9.5, and 5‐HT2AR/5‐HT2CR in the rat lateral habenula. Photomicrographs of coronal sections showing the colocalization of the 5‐HT2AR with HuC/D (A1‐A3), the 5‐HT2CR with PGP 9.5 (B1‐B3), and the 5‐HT2AR with the 5‐HT2CR (C1‐C3) in the rat LHb. Arrowheads indicate double‐immunolabeled neurons. The percentage of neurons that expressed 5‐HT2ARs (A1‐A3) and 5‐HT2CRs (B1‐B3) was very low. In addition, few neurons expressed both receptors (C1‐C3). Arrows in C1‐C3 indicate single‐labeled neurons. (D‐E) Photomicrographs of the colocalization of 5‐HT2AR/GFAP and 5‐HT2CR/GFAP in the rat LHb. Photomicrographs of coronal sections showing the colocalization of the 5‐HT2AR with GFAP (D1‐D3) and the 5‐HT2CR with GFAP (E1‐E3) in the rat LHb. Colocalization is indicated by yellow in merged. Note the strong 5‐HT2AR immunoreactivity in astrocytes (D1‐D3; see also boxed inset). Virtually, none of astrocyte cells expressed the 5‐HT2CR (E1‐E3; see also boxed inset). Arrows in D1 and D3 indicate a 5‐HT2AR‐immunoreactive neurons. Arrows in E1 and E3 indicate a 5‐HT2CR‐immunoreactive neurons. 5‐HT2AR: serotonin‐2A receptor; 5‐HT2CR: serotonin‐2C receptor. Scale bar = 50 μm in E3 (applies to A1‐E3)
Figure 6
Figure 6
Assessing Proximity ligation assay (PLA)‐based 5‐HT2AR:5‐HT2CR interaction. (A) PL for 5‐HT2A:5‐HT2CR interaction did not reveal signal in the LHb, suggesting that the 2 serotonin receptor isoforms are not represented in the same complex. (B) Positive PL control reporting signal of interaction between the 2 NMDA receptor subunits NR1:NR2A. (C) Quantification of absolute PL signal intensity for 5‐HT2A:5‐HT2C and NR1:NR2A. Each dot represents the average of the analysis performed in a single animal (n = 6 for each experimental group). 5‐HT2A: serotonin‐2A; 5‐HT2C: serotonin‐2C; PL: proximity ligation; NMDA: N‐methyl‐d‐aspartate

Similar articles

Cited by

References

    1. Metzger M, Bueno D, Lima LB. The lateral habenula and the serotonergic system. Pharmacol Biochem Behav. 2017;162:22‐28. - PubMed
    1. Tchenio A, Valentinova K, Mameli M. Can the Lateral Habenula Crack the Serotonin Code? Front Synaptic Neurosci. 2016;8:34. - PMC - PubMed
    1. De Deurwaerdere P, Di Giovanni G. Serotonergic modulation of the activity of mesencephalic dopaminergic systems: therapeutic implications. Prog Neurobiol. 2017;151:175‐236. - PubMed
    1. Howell LL, Cunningham KA. Serotonin 5‐HT2 receptor interactions with dopamine function: implications for therapeutics in cocaine use disorder. Pharmacol Rev. 2015;67:176‐197. - PMC - PubMed
    1. Millan MJ. Serotonin 5‐HT2C receptors as a target for the treatment of depressive and anxious states: focus on novel therapeutic strategies. Therapie. 2005;60:441‐460. - PubMed

Publication types