Clinical Trial
. 2018 Apr 2;128(4):1371-1383.
doi: 10.1172/JCI96153. Epub 2018 Feb 26.

Integrated RNA and DNA sequencing reveals early drivers of metastatic breast cancer

Affiliations
Clinical Trial

Integrated RNA and DNA sequencing reveals early drivers of metastatic breast cancer

Marni B Siegel et al. J Clin Invest. .

Abstract

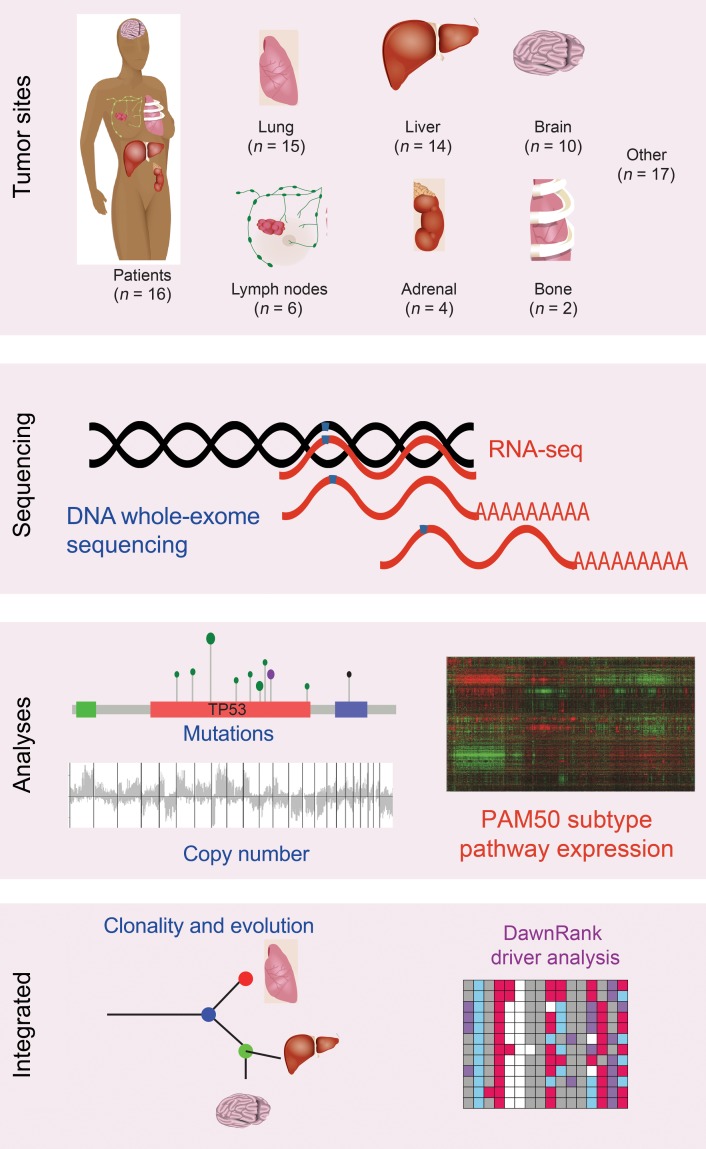
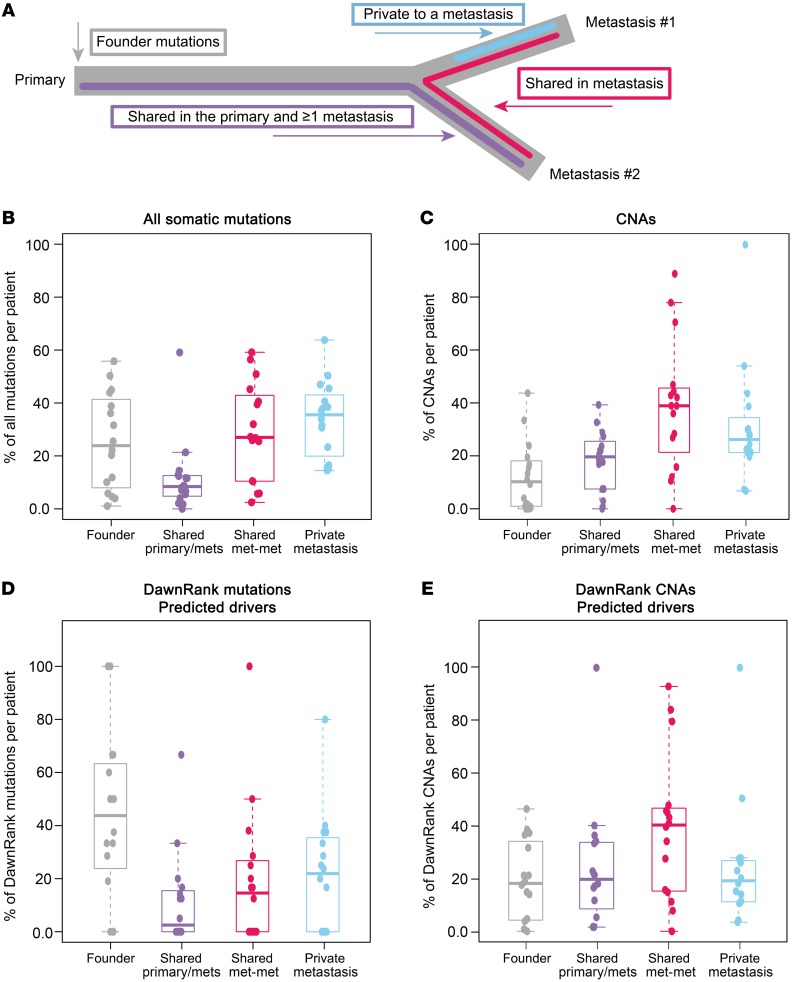
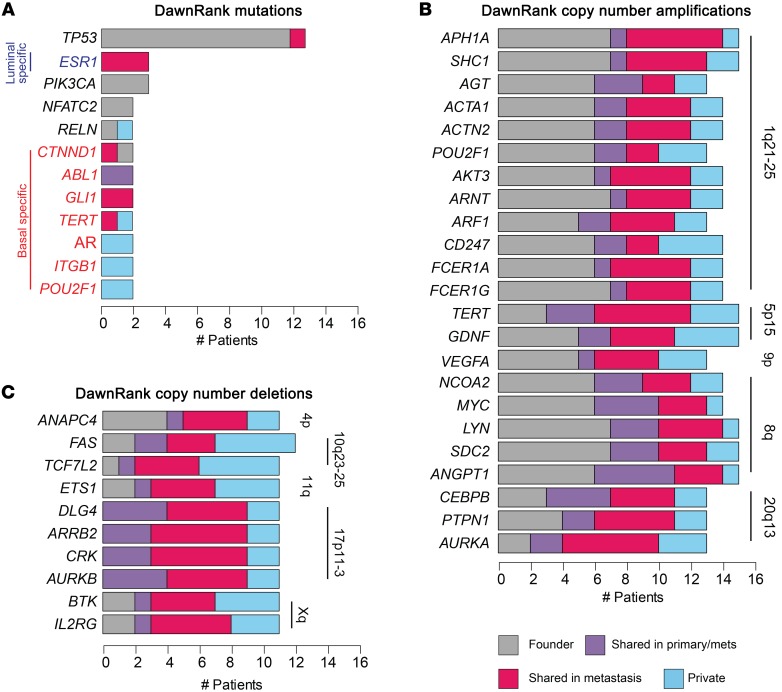
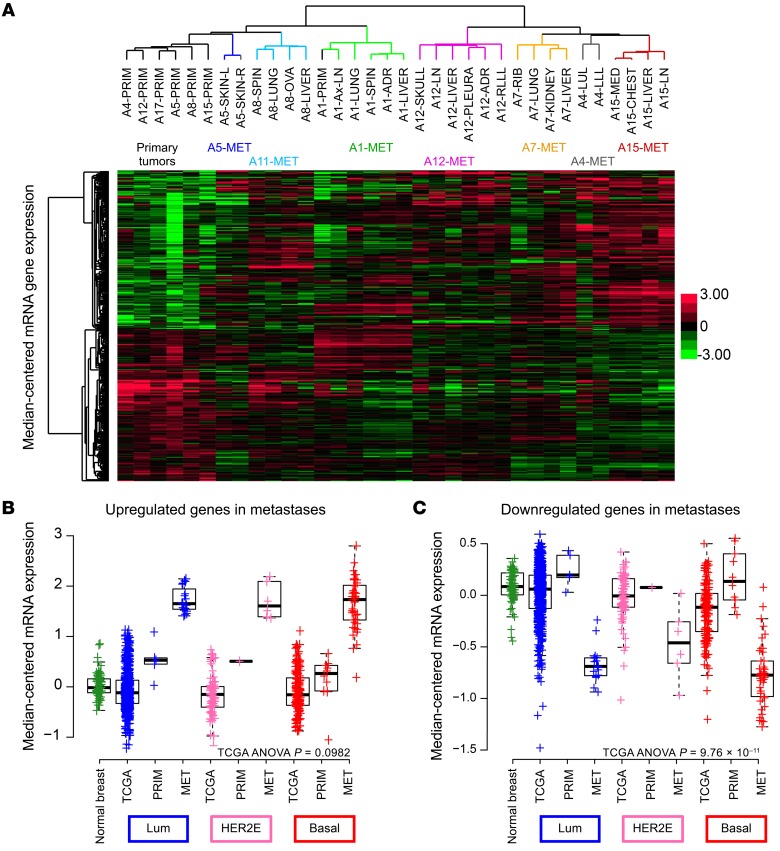
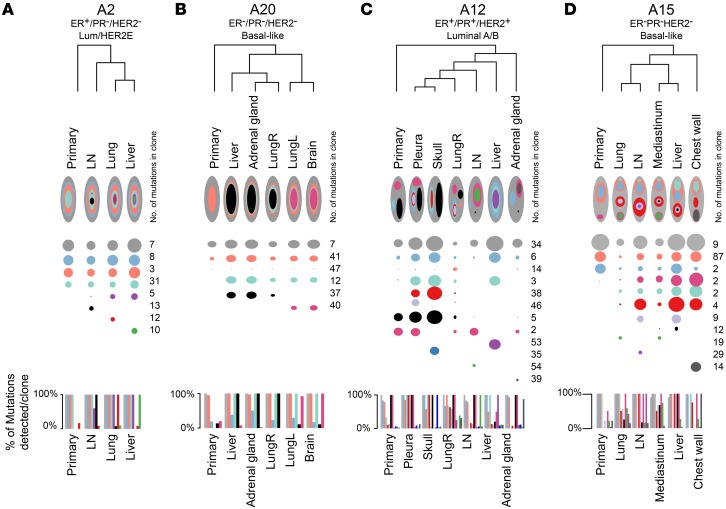
Breast cancer metastasis remains a clinical challenge, even within a single patient across multiple sites of the disease. Genome-wide comparisons of both the DNA and gene expression of primary tumors and metastases in multiple patients could help elucidate the underlying mechanisms that cause breast cancer metastasis. To address this issue, we performed DNA exome and RNA sequencing of matched primary tumors and multiple metastases from 16 patients, totaling 83 distinct specimens. We identified tumor-specific drivers by integrating known protein-protein network information with RNA expression and somatic DNA alterations and found that genetic drivers were predominantly established in the primary tumor and maintained through metastatic spreading. In addition, our analyses revealed that most genetic drivers were DNA copy number changes, the TP53 mutation was a recurrent founding mutation regardless of subtype, and that multiclonal seeding of metastases was frequent and occurred in multiple subtypes. Genetic drivers unique to metastasis were identified as somatic mutations in the estrogen and androgen receptor genes. These results highlight the complexity of metastatic spreading, be it monoclonal or multiclonal, and suggest that most metastatic drivers are established in the primary tumor, despite the substantial heterogeneity seen in the metastases.

Keywords: Breast cancer; Oncology.


Conflict of interest statement

Conflict of interest: CMP is an equity stock holder of BioClassifier LLC and University Genomics, and ERM, JSP, and CMP have filed a US patent on the PAM50 subtyping assay (US 12995459).

Figures

Figure 1
Figure 1. Overview of the study methods.
Primary tumors and 68 metastases from 16 patients who died of metastatic breast cancer were sequenced with both DNA whole-exome sequencing and RNA sequencing. DNA somatic mutations, somatic copy number alterations, and RNA gene expression were called. Biologic subtype was determined with the PAM50 predictor. Clonality was determined from the DNA mutations. Genetic drivers were predicted using the DawnRank driver analysis tool, integrating RNA expression, DNA mutations, and copy number.
Figure 2
Figure 2. Timing of somatic alterations and driver acquisition in metastases.
Somatic DNA alterations within a single patient classified into 4 categories on the basis of a hypothesized timing with which they were acquired during the development of metastasis. (A) Founder alterations established in the primary tumor and observed in all metastases (gray), shared in the primary tumor and metastases but not in all tumors (purple), shared in 2 metastases but not the primary tumor (pink), and private to 1 metastasis (blue). The distributions of all (B) somatic mutations, (C) somatic CNAs, (D) DawnRank predicted mutations, and (E) DawnRank CNAs within each patient. shared primary/mets, shared in the primary tumor and metastases but not in all tumors; shared met-met, shared in 2 metastases but not the primary tumor.
Figure 3
Figure 3. Timing and frequency of predicted drivers in primary and metastatic breast cancers.
(A) DawnRank drivers from somatic mutations. (B) DawnRank copy number amplifications in at least 12 of 16 patients, and (C) deletions in at least 10 of 16 patients. Each alteration is characterized per patient as a founder alteration (gray), an alteration shared in the primary tumor and metastases (primary/mets) (purple), an alteration shared in 2 metastases but not in the primary tumor (pink), or an alteration private to 1 metastasis (blue). Copy number–altered drivers are annotated with the chromosomal cytoband location.
Figure 4
Figure 4. Differential gene expression in metastases.
(A) Hierarchical clustering of median-centered RNA gene expression defined as significantly differentially expressed genes in metastases (Mets) as compared with matched primary tumors (Primaries) with the lmer function in R. Each color in the dendrogram identifies a different patient. Box plots of the mean signature score of (B) upregulated genes and (C) downregulated genes, comparing the following categories: TCGA normal breast tissue, TCGA luminal A/B primary tumors, UNC RAP luminal primary tumors, UNC RAP luminal metastases, TCGA HER2-enriched primary tumors, UNC RAP HER2-enriched primary tumors, UNC RAP HER2-enriched metastases, TCGA basal-like primary tumors, UNC RAP basal-like primary tumors, and UNC RAP basal-like metastases. ADR, adrenal gland; Ax-LN, axillary lymph node; Basal, basal-like; HER2E, HER2-enriched; Lum, luminal; LLL, left lower lobe; LUL, left upper lobe; MED, mediastinum MET, metastases; OVA, ovary; PRIM, primary tumor; RLL, right lower lobe; SKIN-L, left skin; SKIN-R, right skin ; SPIN, spinal.
Figure 5
Figure 5. Multiclonal and monoclonal metastatic seeding patterns in breast cancer patients.
(AC) Dendograms depicting the overall relationship of the tumors in (A) patient A2, (B) patient A20, (C) patient A12, and (D) patient A15. Each subclone detected in a patient is represented as a separate color along the x axis for each primary tumor and metastasis on the y axis. The radius of each circle is proportionate to the mean cellular prevalence of that clone in each tumor. The total number of mutations per clone is indicated on the right, and the percentages of mutations detected in that clone in each tumor are plotted as a bar graph below each dendogram. Across subtypes, monoclonal seeding patterns in (A) patient A2 (ER+, luminal) and (B) patient A20 (ER/PR/HER2, basal-like) and multiclonal patterns in both (C) luminal (patient A12) and (D) basal-like (patient A15) tumors are shown. LungL, left lung; LungR, right lung.

References

    1. Yates LR, et al. Subclonal diversification of primary breast cancer revealed by multiregion sequencing. Nat Med. 2015;21(7):751–759. doi: 10.1038/nm.3886. - DOI - PMC - PubMed
    1. Shah SP, et al. The clonal and mutational evolution spectrum of primary triple-negative breast cancers. Nature. 2012;486(7403):395–399. - PMC - PubMed
    1. Nik-Zainal S, et al. The life history of 21 breast cancers. Cell. 2012;149(5):994–1007. doi: 10.1016/j.cell.2012.04.023. - DOI - PMC - PubMed
    1. Perou CM, et al. Molecular portraits of human breast tumours. Nature. 2000;406(6797):747–752. doi: 10.1038/35021093. - DOI - PubMed
    1. Curtis C, et al. The genomic and transcriptomic architecture of 2,000 breast tumours reveals novel subgroups. Nature. 2012;486(7403):346–352. - PMC - PubMed

Publication types