. 2018 Apr;15(4):283-289.
doi: 10.1038/nmeth.4610. Epub 2018 Feb 26.

Cell-type specific sequencing of microRNAs from complex animal tissues

Affiliations

Cell-type specific sequencing of microRNAs from complex animal tissues

Chiara Alberti et al. Nat Methods. 2018 Apr.

Abstract

MicroRNAs (miRNAs) play an essential role in the post-transcriptional regulation of animal development and physiology. However, in vivo studies aimed at linking miRNA function to the biology of distinct cell types within complex tissues remain challenging, partly because in vivo miRNA-profiling methods lack cellular resolution. We report microRNome by methylation-dependent sequencing (mime-seq), an in vivo enzymatic small-RNA-tagging approach that enables high-throughput sequencing of tissue- and cell-type-specific miRNAs in animals. The method combines cell-type-specific 3'-terminal 2'-O-methylation of animal miRNAs by a genetically encoded, plant-specific methyltransferase (HEN1), with chemoselective small-RNA cloning and high-throughput sequencing. We show that mime-seq uncovers the miRNomes of specific cells within Caenorhabditis elegans and Drosophila at unprecedented specificity and sensitivity, enabling miRNA profiling with single-cell resolution in whole animals. Mime-seq overcomes current challenges in cell-type-specific small-RNA profiling and provides novel entry points for understanding the function of miRNAs in spatially restricted physiological settings.


Conflict of interest statement

The authors declare no competing financial interests.

Figures

Figure 1
Figure 1. The methyltransferase HEN1 from Arabidopsis thaliana methylates animal miRNAs in vitro and in vivo.
(a) Biogenesis of miRNAs in plants and animals, and scheme of the strategy for discrimination of methylated and unmethylated miRNAs. (b) Total RNA extracted from wild type or transgenic (with the indicated transgenes) female adult flies was subjected to β-elimination and high-resolution Northern hybridization using probes against the indicated miRNAs. 2SrRNA served as control for loading and β-elimination. Independent repeats = 2. (c) Total RNA extracted from wild type or transgenic C. elegans L1-stage worms was subjected to β-elimination and Northern hybridization using probes against the indicated miRNAs. tRNAGly served as control for loading and β-elimination. Independent repeats = 2. For full scans of all blots see Suppl. Fig. 9 and 10.
Figure 2
Figure 2. Periodate-mediated oxidation enables selective cloning of animal miRNAs upon restrictive Ath-HEN1-directed methylation.
(a) Total RNA derived from Drosophila (dme) S2hen1 cells expressing Ath-HEN1 was mixed with total RNA from mouse (mmu) embryonic stem cells at the indicated ratios (input ratio), followed by small RNA cloning before (-ox) and after (+ox) oxidation by periodate-treatment (in triplicate). The percentage of small RNAs mapping to annotated mouse (mmu miR) or fly miRNAs (dme miR) is indicated. The number of abundantly expressed (>100 cpm in untreated 1:1 input ratio libraries) fly miRNAs detected in the respective libraries at a read depth of >100 cpm is indicated in parenthesis. (b) Volcano plots show fold-change and associated p-Values (determined by DESeq2) for the indicated number (n) of abundantly expressed fly (red) or mouse (black) miRNAs in small RNA libraries generated from the indicated input ratios. TPR and FPR = true- and false-positive recovery rates respectively (for their determination, see text and Online Methods).
Figure 3
Figure 3. Mime-seq reproducibly recovers neuronal miRNAs in C. elegans.
(a) Volcano plots show fold-change upon oxidation and associated p-Values (determined by DESeq2) for each expressed miRNA, obtained from total RNA from L1-stage worms expressing Ath-HEN1 from three independent pan-neuronal drivers. MicroRNAs with validated neuronal expression are indicated in red. (b) Pair-wise comparisons of fold-change in abundance after oxidation for each expressed mature miRNA in the three independent, pan-neuronal Ath-HEN1 experiments (two biologically independent experiments per driver). Spearman’s correlation coefficients and associated p-Values are shown. (c) Venn diagram showing the overlap of significantly enriched miRNAs in the three pan-neuronal experiments. The number of miRNAs in each section is shown. The number of transcriptional-reporter-validated miRNAs is indicated in parenthesis. (d) Representative DIC and fluorescence images of C. elegans larvae expressing fosmid reporters for two neuronal miRNAs identified by mime-seq. At least 10 animals from each of three independent transgenic lines analyzed per reporter. Scale bars = 10 µm.
Figure 4
Figure 4. Mime-seq unveils the miRNomes of diverse tissues in C. elegans.
(a) Volcano plots show fold-change and associated p-Values (determined by DESeq2) of miRNAs after oxidation compared to untreated conditions in small RNA libraries prepared from the indicated transgenic C. elegans strains (two biologically independent experiments for each driver). Transcriptional-reporter-validated miRNAs are highlighted in color. (b) Representative images of C. elegans larvae expressing fosmid reporters for candidate tissue-specific miRNAs identified by mime-seq. At least 10 animals analyzed per transgenic line. Number of transgenic lines = 2 for miR-251, 3 for miR-243, 1 for miR-1. Scale bars = 10 µm. (c) Venn diagram shows the number of common and restricted miRNAs identified by mime-seq (log2 Fold Change>1, p-Value<0.001), for the indicated tissues.
Figure 5
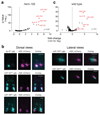
Figure 5. Mime-seq has the sensitivity to retrieve miRNAs from 1/300 cells.
(a) Volcano plot shows fold-change upon oxidation and associated p-Values for each expressed miRNAs, obtained from total RNA from henn-1-deficient, L1-stage worms expressing Ath-HEN1 exclusively in the ASE neuron pair (two biologically independent experiments). Validated ASE-expressed miRNAs are in red. (b) Representative images of larvae carrying fosmid reporters for known ASE miRNAs (lsy-6, miR-790, miR-791, miR-793) and a newly discovered ASE miRNA (miR-1821). Lateral views are shown for those reporters where expression in additional neurons occludes the dorsal view. At least 10 animals analyzed per independent transgenic lines. Number of transgenic lines = 2 for miR-793 and miR-1821, 3 for miR-790, miR-791 and lsy-6. Scale bars = 10 µm. (c) Same as in (a) but in wt background. The enrichments shown are after subtraction of the background enrichment in non-transgenic, wt animals to account for endogenous HENN-1-mediated methylation.

References

    1. Bartel DP. MicroRNAs: target recognition and regulatory functions. Cell. 2009;136:215–233. - PMC - PubMed
    1. Aboobaker AA, Tomancak P, Patel N, Rubin GM, Lai EC. Drosophila microRNAs exhibit diverse spatial expression patterns during embryonic development. Proc Natl Acad Sci USA. 2005;102:18017–18022. - PMC - PubMed
    1. Landgraf P, et al. A Mammalian microRNA Expression Atlas Based on Small RNA Library Sequencing. Cell. 2007;129:1401–1414. - PMC - PubMed
    1. Martinez NJ, et al. Genome-scale spatiotemporal analysis of Caenorhabditis elegans microRNA promoter activity. Genome Research. 2008;18:2005–2015. - PMC - PubMed
    1. Park CY, et al. A resource for the conditional ablation of microRNAs in the mouse. CellReports. 2012;1:385–391. - PMC - PubMed

Publication types