. 2018 Feb 26;14(2):e1006900.
doi: 10.1371/journal.ppat.1006900. eCollection 2018 Feb.

Timing of host feeding drives rhythms in parasite replication

Affiliations

Timing of host feeding drives rhythms in parasite replication

Kimberley F Prior et al. PLoS Pathog. .

Abstract

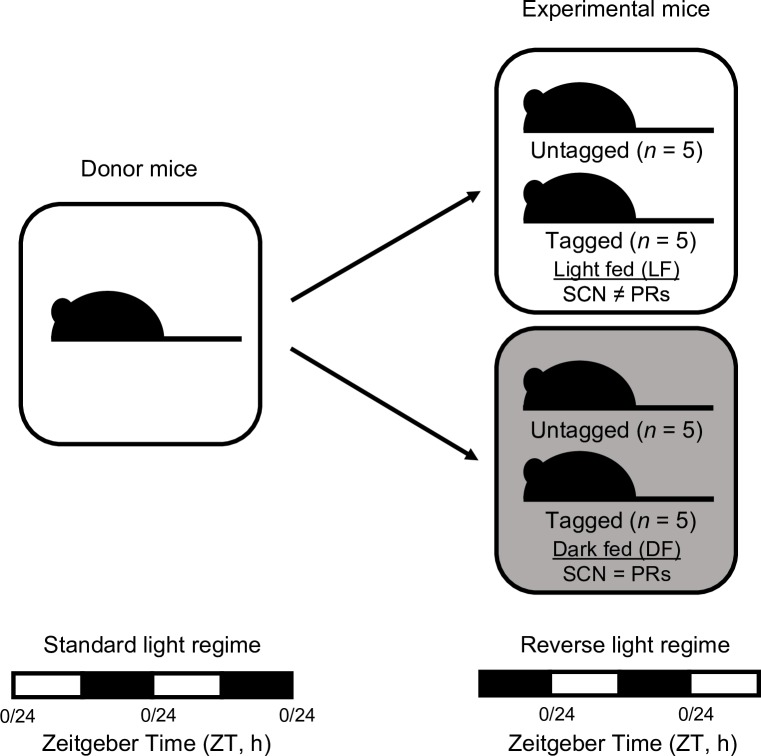
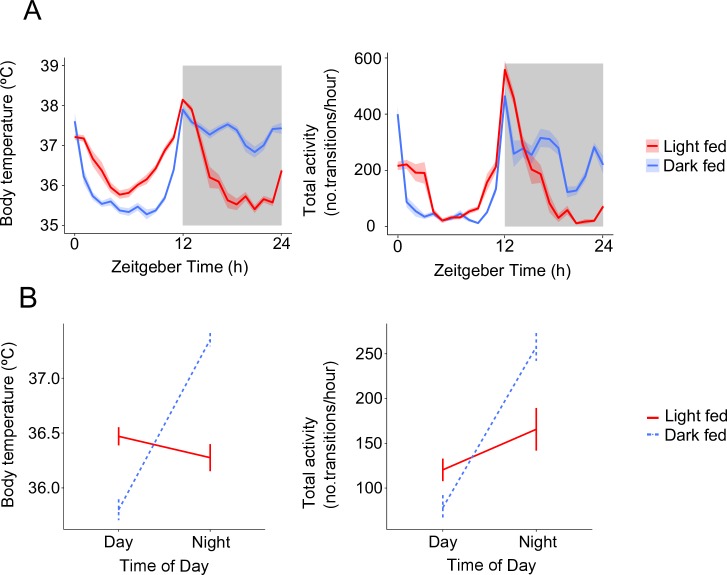
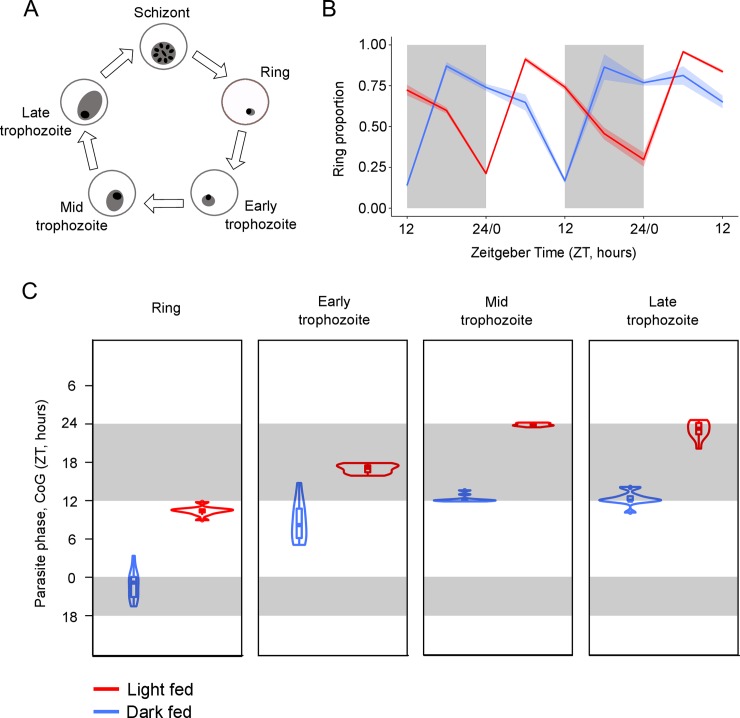
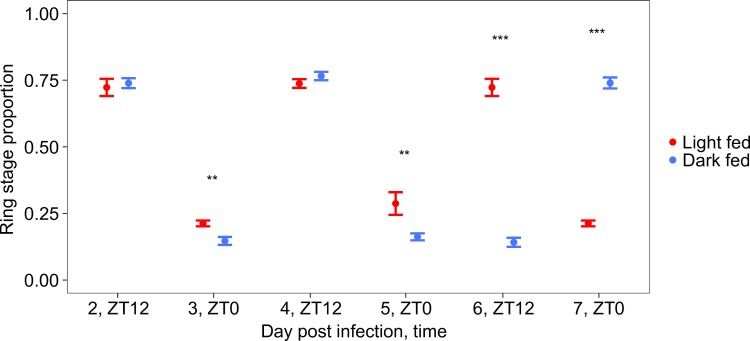
Circadian rhythms enable organisms to synchronise the processes underpinning survival and reproduction to anticipate daily changes in the external environment. Recent work shows that daily (circadian) rhythms also enable parasites to maximise fitness in the context of ecological interactions with their hosts. Because parasite rhythms matter for their fitness, understanding how they are regulated could lead to innovative ways to reduce the severity and spread of diseases. Here, we examine how host circadian rhythms influence rhythms in the asexual replication of malaria parasites. Asexual replication is responsible for the severity of malaria and fuels transmission of the disease, yet, how parasite rhythms are driven remains a mystery. We perturbed feeding rhythms of hosts by 12 hours (i.e. diurnal feeding in nocturnal mice) to desynchronise the host's peripheral oscillators from the central, light-entrained oscillator in the brain and their rhythmic outputs. We demonstrate that the rhythms of rodent malaria parasites in day-fed hosts become inverted relative to the rhythms of parasites in night-fed hosts. Our results reveal that the host's peripheral rhythms (associated with the timing of feeding and metabolism), but not rhythms driven by the central, light-entrained circadian oscillator in the brain, determine the timing (phase) of parasite rhythms. Further investigation reveals that parasite rhythms correlate closely with blood glucose rhythms. In addition, we show that parasite rhythms resynchronise to the altered host feeding rhythms when food availability is shifted, which is not mediated through rhythms in the host immune system. Our observations suggest that parasites actively control their developmental rhythms. Finally, counter to expectation, the severity of disease symptoms expressed by hosts was not affected by desynchronisation of their central and peripheral rhythms. Our study at the intersection of disease ecology and chronobiology opens up a new arena for studying host-parasite-vector coevolution and has broad implications for applied bioscience.


Conflict of interest statement

The authors have declared that no competing interests exist.

Figures

Fig 1
Fig 1. Experimental design, feeding time.
Infections were initiated with parasites raised in donor mice entrained to a standard light regime [lights on: 7am (ZT 0/24) and lights off: 7pm (ZT 12)] and used to create experimental infections in hosts entrained to a reverse light regime of 12-hours light: 12-hours dark [lights on: 7pm (ZT 0/24), lights off: 7am (ZT 12); ZT is Zeitgeber Time: hours after lights on], leading to a 12-hour phase difference in SCN rhythms of donor and host, and subsequently, parasite infections (see Materials and Methods for the rationale). Hosts were then assigned to one of the two treatment groups. One group (N = 10) were allowed access to food between ZT0 and ZT12 (“light fed mice”, LF, food access during the day) and the other group (N = 10) allowed access to food between ZT12 and ZT0 (“dark fed mice”, DF, food access during the night). Body temperature and locomotor activity were recorded from a subset of RFID “tagged” mice in each group (N = 5 per group). Changing feeding time (day time feeding of nocturnal mice) desynchronises rhythmic outputs from the central (SCN) oscillator and the peripheral (peripheral rhythms, PRs) oscillators (“SCN ≠ PRs”), whereas the SCN and peripheral rhythms remain synchronised in mice fed at night (“SCN = PRs”).
Fig 2
Fig 2. Feeding nocturnal mice in the day time disrupts rhythms in body temperature and locomotor activity.
(A) Hourly mean ± SEM body temperature and locomotor activity (number of transitions per hour is the average number of movements a mouse makes in an hour, between antennae on the Home Cage Analysis system, see Materials and Methods) and (B) interaction between time-of-day and treatment group on body temperature and locomotor activity (calculating the mean temperature/activity across the day, ZT 0–12, and night, ZT 12–24, ± SEM) averaged from 48 hours of monitoring mice before infection. N = 5 for each of the light fed (LF, red) and dark fed (DF, blue) groups. Light and dark bars indicate lights on and lights off (lights on: ZT 0/24, lights off: ZT 12).
Fig 3
Fig 3. Parasite rhythms are inverted in hosts fed during the day compared to the night.
(A) The asexual cycle of malaria parasites is characterised by five morphologically distinct developmental stages (ring, early trophozoite, mid trophozoite, late trophozoite) differentiated by parasite size within the red blood cell, the size and number of nuclei, and the appearance of haemozoin [31]. (B) Mean ± SEM (N = 10 per group) proportion of observed parasites in the blood at ring stage in light fed mice (red; allowed access to food during the day, between ZT 0 and ZT 12) and dark fed mice (blue; allowed access to food during the night, between ZT 12 and ZT 24). The proportion of parasites at ring stage in the peripheral blood is highest at night (ZT 22) in dark fed mice but in the day (ZT 10) for light fed mice, illustrating the patterns observed for all other (rhythmic) stages (see S2 Fig). (C) CoG (estimate of phase) in ZT (h) for each rhythmic parasite stage in the blood. Each violin illustrates the median ± IQR overlaid with probability density (N = 10 per group). The height of the violin illustrates the variation in the timing of the CoG between mice and the width illustrates the frequency of the CoGs at particular times within the distribution. Sampling occurred every 6 hours days 6–8 post infection. Light and dark bars indicate lights on and lights off (lights on: ZT 0, lights off: ZT 12).
Fig 4
Fig 4. Parasite rhythms in light and dark fed mice significantly diverge by day 5–6 post infection.
The proportion of ring stage parasites across infections (light fed mice, red, and dark fed mice, blue) as a phase marker reveals that rhythms of parasites in light fed mice (red) and dark fed mice (blue) diverge. Mice were sampled at ZT 12 on days 2, 4 and 6 and at ZT 0 on days 3, 5 and 7 post infection (see Fig 3 and S2 Fig). Consistent significant differences (**, p < 0.05; ***, p < 0.001) between feeding treatments begins on day 5. By days 6–7 post infection, rings in light fed mice are present at ZT12 while rings in dark fed mice are present at ZT 0, indicating that parasites in dark fed mice have rescheduled. Ring stages are presented as the phase marker because this is the most accurately quantified stage but other stages follow a similar pattern (S3 Table). Mean ± SEM is plotted and N = 10 for each treatment group.
Fig 5
Fig 5. Rhythms in inflammatory cytokines follow rhythms in parasite development.
Mean ± SEM (N = 4 per time point) for cytokines (A) IFN-gamma and (B) TNF-alpha for parasites matched and mismatched to the SCN rhythms of the host (matched: green, mismatched: orange). Sampling occurred every 3 hours on days 4–5 post infection. Matched parasites undergo schizogony around ZT 17, (indicated by green dashed line) and mismatched parasites undergo schizogony 6 hours later, around ZT 23 (indicated by orange dashed line). IFN-gamma peaks at ZT 21.29 in matched infections (green) and at ZT 0 in mismatched infections (orange). TNF-alpha peaks at ZT 19.26 in matched infections (green) and at ZT 1.29 in mismatched infections (orange). Light and dark bars indicate lights on and lights off (lights on: ZT 0, lights off: ZT 12).
Fig 6
Fig 6. Feeding mice in the day time affects blood glucose regulation.
A) Mean ± SEM (N = 5 per group) for light fed mice (LF, white bars; allowed access to food from ZT 0-ZT 12) and dark fed mice (DF, grey bars; allowed access to food from ZT 12-ZT 0). Blood glucose concentration was measured every ~2 hours for 30 hours from ZT 0. Steep increases in blood glucose concentration occur as a result of the main bout of feeding in each group (i.e. just after lights on in LF mice and lights off in DF mice, illustrated by the regions with solid lines connecting before and after the main bout, see S5 Table), and suggests glucose concentration is inverted during the night. Light and dark bars indicate lights on and lights off (lights on: ZT 0, lights off: ZT 12). B) as for A, but plotted as a polar graph with corresponding developmental stages for each treatment group (red, LF; blue DF) on the perimeter.

References

    1. Hevia MA, Canessa P, Müller-Esparza H, Larrondo LF. A circadian oscillator in the fungus Botrytis cinerea regulates virulence when infecting Arabidopsis thaliana. PNAS. 2015;112: 8744–8749. doi: 10.1073/pnas.1508432112 - DOI - PMC - PubMed
    1. N’Goran E, Brémond P, Sellin E, Sellin B, Théron A. Intraspecific diversity of Schistosoma haematobium in West Africa: chronobiology of cercarial emergence. Acta Trop. 1997;66: 35–44. - PubMed
    1. Dolnik OV, Metzger BJ, Loonen MJJE. Keeping the clock set under the midnight sun: diurnal periodicity and synchrony of avian Isospora parasites cycle in the High Arctic. Parasitol. 2011;138: 1077–1081. - PubMed
    1. Hawking F. The 24-hour periodicity of microfilariae: biological mechanisms responsible for its production and control. Proc Roy Soc B. 1967;169: 59–76.
    1. Hawking F. Circadian rhythms of Trypanosoma congolense in laboratory rodents. Trans R Soc Trop Med Hyg. 1978;72: 592–595. - PubMed

Publication types