. 2018 Feb 26;18(1):24.
doi: 10.1186/s12874-018-0482-1.

DeepSurv: personalized treatment recommender system using a Cox proportional hazards deep neural network

Affiliations

DeepSurv: personalized treatment recommender system using a Cox proportional hazards deep neural network

Jared L Katzman et al. BMC Med Res Methodol. .

Abstract

Background: Medical practitioners use survival models to explore and understand the relationships between patients' covariates (e.g. clinical and genetic features) and the effectiveness of various treatment options. Standard survival models like the linear Cox proportional hazards model require extensive feature engineering or prior medical knowledge to model treatment interaction at an individual level. While nonlinear survival methods, such as neural networks and survival forests, can inherently model these high-level interaction terms, they have yet to be shown as effective treatment recommender systems.

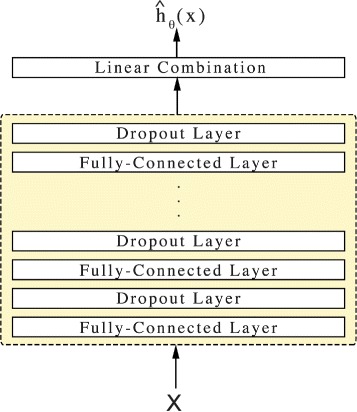
Methods: We introduce DeepSurv, a Cox proportional hazards deep neural network and state-of-the-art survival method for modeling interactions between a patient's covariates and treatment effectiveness in order to provide personalized treatment recommendations.

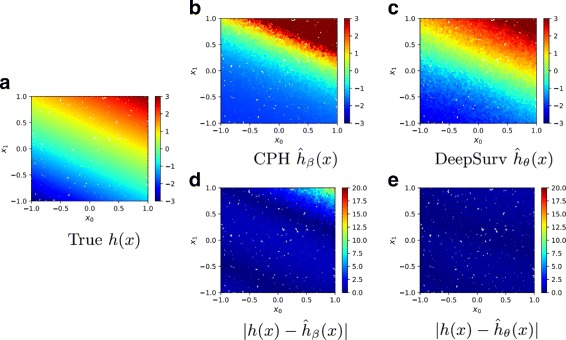
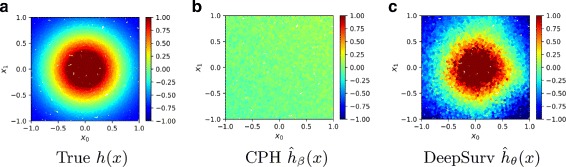
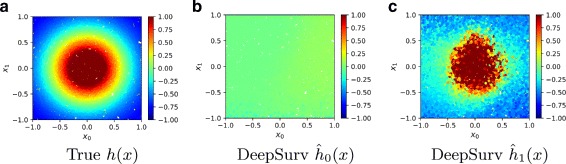
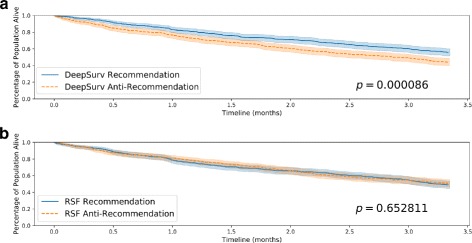
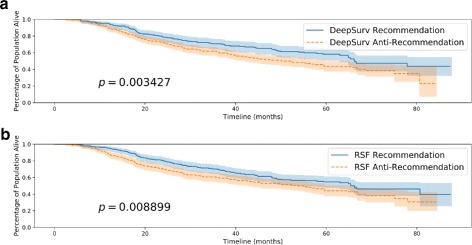
Results: We perform a number of experiments training DeepSurv on simulated and real survival data. We demonstrate that DeepSurv performs as well as or better than other state-of-the-art survival models and validate that DeepSurv successfully models increasingly complex relationships between a patient's covariates and their risk of failure. We then show how DeepSurv models the relationship between a patient's features and effectiveness of different treatment options to show how DeepSurv can be used to provide individual treatment recommendations. Finally, we train DeepSurv on real clinical studies to demonstrate how it's personalized treatment recommendations would increase the survival time of a set of patients.

Conclusions: The predictive and modeling capabilities of DeepSurv will enable medical researchers to use deep neural networks as a tool in their exploration, understanding, and prediction of the effects of a patient's characteristics on their risk of failure.

Keywords: Deep learning; Survival analysis; Treatment recommendations.


Conflict of interest statement

Ethics approval and consent to participate

Not applicable.

Consent for publication

Not applicable.

Competing interests

The authors declare that they have no competing interests.

Publisher’s Note

Springer Nature remains neutral with regard to jurisdictional claims in published maps and institutional affiliations.

Figures

Fig. 1
Fig. 1
Diagram of DeepSurv. DeepSurv is a configurable feed-forward deep neural network. The input to the network is the baseline data x. The network propagates the inputs through a number of hidden layers with weights θ. The hidden layers consist of fully-connected nonlinear activation functions followed by dropout. The final layer is a single node which performs a linear combination of the hidden features. The output of the network is taken as the predicted log-risk function ĥθ(x). The hyper-parameters of the network (e.g. number of hidden layers, number of nodes in each layer, dropout probability, etc.) were determined from a random hyper-parameter search and are detailed in Table 3
Fig. 2
Fig. 2
Simulated Linear Experimental Log-Risk Surfaces. Predicted log-risk surfaces and errors for the simulated survival data with linear log-risk function with respect to a patient’s covariates x0 and x1. a The true log-risk h(x)=x0+2x1 for each patient. b The predicted log-risk surface of ĥβ(x) from the linear CPH model parameterized by β. c The output of DeepSurv ĥθ(x) predicts a patient’s log-risk. d The absolute error between true log-risk h(x) and CPH’s predicted log-risk ĥβ(x). e The absolute error between true log-risk h(x) and DeepSurv’s predicted log-risk ĥθ(x)
Fig. 3
Fig. 3
Simulated Nonlinear Experimental Log-Risk Surfaces. Log-risk surfaces of the nonlinear test set with respect to patient’s covariates x0 and x1. a The calculated true log-risk h(x) (Eq. 9) for each patient. b The predicted log-risk surface of ĥβ(x) from the linear CPH model parameterized on β. The linear CPH predicts a constant log-risk. c The output of DeepSurv ĥθ(x) is the estimated log-risk function
Fig. 4
Fig. 4
Simulated Treatment Log-Risk Surface. Treatment Log-Risk Surfaces as a function of a patient’s relevant covariates x0 and x1. a The true log-risk h1(x) if all patients in the test set were given treatment τ=1. We then manually set all treatment groups to either τ=0 or τ=1. b The predicted log-risk ĥ0(x) for patients with treatment group τ=0. c The network’s predicted log-risk ĥ1(x) for patients in treatment group τ=1
Fig. 5
Fig. 5
Simulated Treatment Survival Curves. Kaplan-Meier estimated survival curves with confidence intervals (α=.05) for the patients who were given the treatment concordant with a method’s recommended treatment (Recommendation) and the subset of patients who were not (Anti-Recommendation). We perform a log-rank test to validate the significance between each set of survival curves. a Effect of DeepSurv’s Treatment Recommendations (Simulated Data), b Effect of RSF’s Treatment Recommendations (Simulated Data)
Fig. 6
Fig. 6
Rotterdam & German Breast Cancer Study Group (GBSG) Survival Curves. Kaplan-Meier estimated survival curves with confidence intervals (α=.05) for the patients who were given the treatment concordant with a method’s recommended treatment (Recommendation) and the subset of patients who were not (Anti-Recommendation). We perform a log-rank test to validate the significance between each set of survival curves. a Effect of DeepSurv’s Treatment Recommendations (GBSG), b Effect of RSF’s Treatment Recommendations (GBSG)

References

    1. RW Y, EA S, DJ K, et al. Development and validation of a prediction rule for benefit and harm of dual antiplatelet therapy beyond 1 year after percutaneous coronary intervention. JAMA. 2016; 315(16):1735–49. https://doi.org/10.1001/jama.2016.3775. - DOI - PMC - PubMed
    1. Royston P, Altman DG. External validation of a cox prognostic model: principles and methods. BMC Med Res Methodol. 2013;13(1):1. doi: 10.1186/1471-2288-13-1. - DOI - PMC - PubMed
    1. Bair E, Tibshirani R. Semi-supervised methods to predict patient survival from gene expression data. PLoS Biol. 2004;2(4):108. doi: 10.1371/journal.pbio.0020108. - DOI - PMC - PubMed
    1. Cheng W-Y, Yang T-HO, Anastassiou D. Development of a prognostic model for breast cancer survival in an open challenge environment. Sci Total Environ. 2013;5(181):181–5018150. - PubMed
    1. Cox DR. In: Kotz S, Johnson NL, (eds).Regression Models and Life-Tables. New York: Springer; 1992, pp. 527–41. 10.1007/978-1-4612-4380-9.

Publication types

MeSH terms