. 2018 Feb 26;19(1):164.
doi: 10.1186/s12864-018-4504-5.

Distinct core promoter codes drive transcription initiation at key developmental transitions in a marine chordate

Affiliations

Distinct core promoter codes drive transcription initiation at key developmental transitions in a marine chordate

Gemma B Danks et al. BMC Genomics. .

Abstract

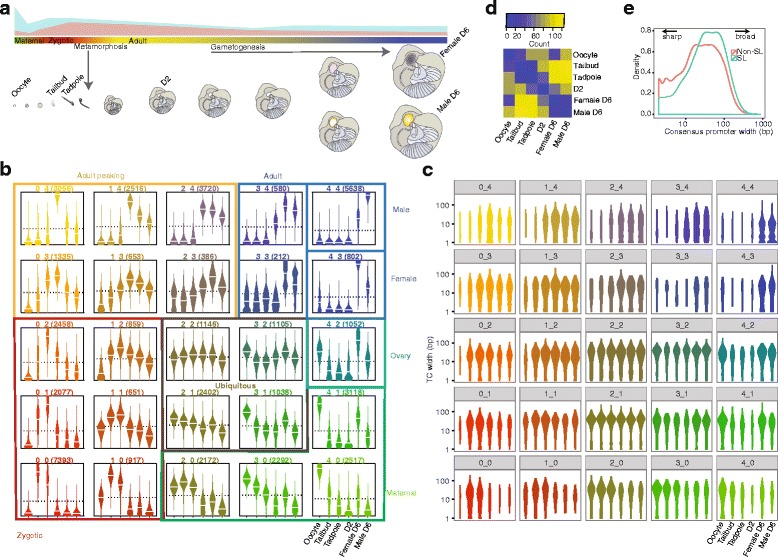
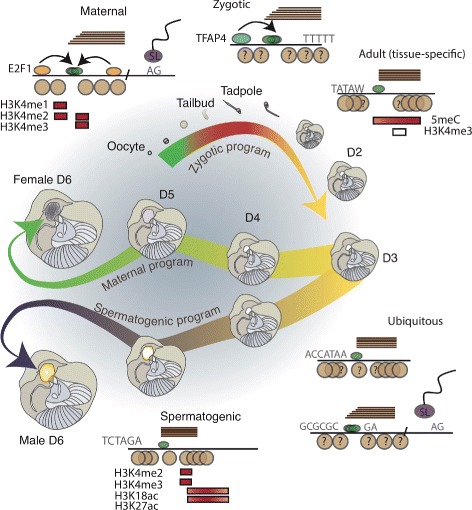
Background: Development is largely driven by transitions between transcriptional programs. The initiation of transcription at appropriate sites in the genome is a key component of this and yet few rules governing selection are known. Here, we used cap analysis of gene expression (CAGE) to generate bp-resolution maps of transcription start sites (TSSs) across the genome of Oikopleura dioica, a member of the closest living relatives to vertebrates.

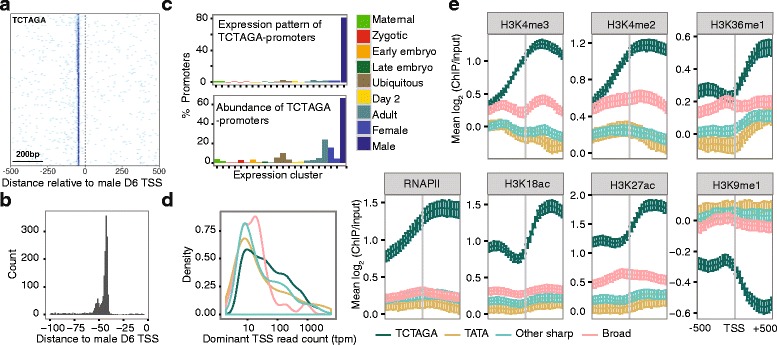
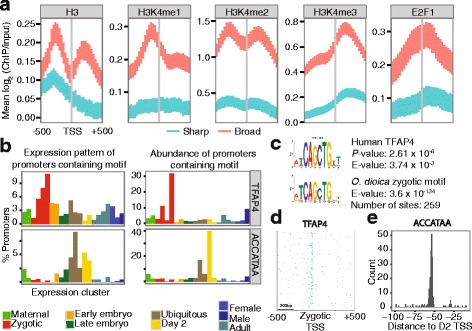
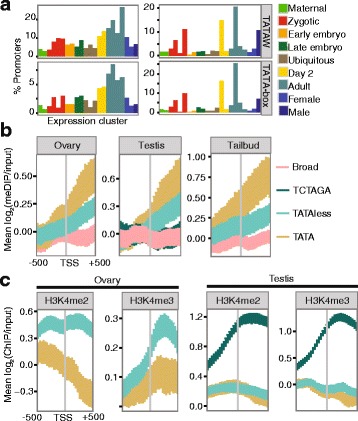
Results: Our TSS maps revealed promoter features in common with vertebrates, as well as striking differences, and uncovered key roles for core promoter elements in the regulation of development. During spermatogenesis there is a genome-wide shift in mode of transcription initiation characterized by a novel core promoter element. This element was associated with > 70% of male-specific transcription, including the use of cryptic internal promoters within operons. In many cases this led to the exclusion of trans-splice sites, revealing a novel mechanism for regulating which mRNAs receive the spliced leader. Binding of the cell cycle regulator, E2F1, is enriched at the TSS of maternal genes in endocycling nurse nuclei. In addition, maternal promoters lack the TATA-like element found in zebrafish and have broad, rather than sharp, architectures with ordered nucleosomes. Promoters of ribosomal protein genes lack the highly conserved TCT initiator. We also report an association between DNA methylation on transcribed gene bodies and the TATA-box.

Conclusions: Our results reveal that distinct functional promoter classes and overlapping promoter codes are present in protochordates like in vertebrates, but show extraordinary lineage-specific innovations. Furthermore, we uncover a genome-wide, developmental stage-specific shift in the mode of TSS selection. Our results provide a rich resource for the study of promoter structure and evolution in Metazoa.

Keywords: Core promoter; DNA methylation; Histone modification; MZT; Oogenesis; Operons; Spermatogenesis; TATA-box; Transcription initiation.


Conflict of interest statement

Ethics approval and consent to participate

Not applicable.

Consent for publication

Not applicable.

Competing interests

The authors declare that they have no competing interests.

Publisher’s Note

Springer Nature remains neutral with regard to jurisdictional claims in published maps and institutional affiliations.

Figures

Fig. 1
Fig. 1
Promoter usage across the O. dioica life cycle. a The 6-day life cycle with stages used for single-nucleotide resolution of TSS-mapping by CAGE are labelled (oocyte, tailbud, tadpole, day 2, female day 6 and male day 6). Changes in the proportion of mRNAs that are trans-spliced (blue) and non-trans-spliced (pink) are shown schematically in the upper panel, above a colour bar indicating major promoter categories (colours corresponding to clusters in (b)). Developmental stages are shown schematically below this bar. b Expression profiles obtained from self-organising map clustering of CAGE TSSs (CTSSs). Each beanplot shows the distribution of relative expression (y-axis) originating at CTSSs (number of CTSSs above each plot) within each cluster at each developmental stage (x-axis) labelled only in the bottom right plot. Coloured boxes and associated labels indicate groups of clusters with similar expression profiles. c Beanplots showing the distribution of interquantile widths of tag clusters (TCs) within each stage and assigned to the expression cluster of the dominant CTSS (plots are ordered and coloured as in (b)) revealing an increase in the use of sharp promoters in adult(tissue)-specific genes. d Heatmap showing the number of promoters that shift up- or down-stream in location between all possible pairs of developmental stages. The highest number of shifting promoters occurs between pre-metamorphic (tailbud) and post-metamorphic (day 2 and day 6) stages. e Distribution of the interquartile widths of consensus promoter regions of trans-spliced (SL) and non-trans-spliced (Non-SL) genes
Fig. 2
Fig. 2
Features of spermatogenic promoters in O. dioica. a Heatmap shows the density of TCTAGA at each position (x-axis) in a -500 to +500 bp region centred on the male dominant TSS for spermatogenic promoter sequences (rows) ordered by promoter width (top to bottom = broad to sharp). Darker blue indicates higher enrichment. b Distribution of distances (median = 44 bp) to the TCTAGA motif relative to the dominant TSS in male day 6 animals. c The TCTAGA motif is specific to transcription in the adult male (final bar in each plot = male-specific (4_4) cluster): of all promoters with a TCTAGA motif the majority have a male-specific expression profile (top). Moreover, the majority of spermatogenic transcription is associated with a TCTAGA motif: of all promoters with a male-specific expression profile the majority contain a TCTAGA, whereas very few promoters in other expression classes contain this motif (bottom). d Distribution of tag counts (tpm) for different promoter classes (see colour key code in e) in the male: TATA = TSS with upstream TATAW element; TCTAGA = TSS with upstream TCTAGA; Sharp = all other promoters with narrow region of TSSs; Broad = dispersed region of TSSs. e ChIP-chip data for day 6 testes are shown for RNAPII, H3K18ac, H3K27ac, H3K4me3, H3K4me2, H3K36me1 and H3K9me1. Each plot shows the mean log2 ratio of ChIP/input at each probe position in a 1000 bp window centered on the dominant TSS. Promoters were categorized according to promoter type as in d. Error bars show 95% confidence intervals for the mean obtained by bootstrapping
Fig. 3
Fig. 3
Features of maternal, zygotic and ubiquitous promoters in O. dioica. a Ordered nucleosome positioning at broad promoters in the ovary. Data are shown for H3, H3K4me1, H3K4me2, H3K4me3 and E2F1 ChIP-chip experiments. Each plot shows the mean log2 ratio of ChIP/input at each probe position in a 1000 bp window centred on the dominant TSS. Promoters were categorized into sharp (blue) and broad (pink) using lower and upper quartiles of widths across all stages. Error bars show 95% confidence intervals for the mean obtained by bootstrapping. b Percentage of all consensus promoters (left) within each expression cluster (x-axis) (profiles shown in Additional file 1: Figure S2A) containing sequence elements as labelled (O. dioica TFAP4-like motif, ACCATAA motif). Percentage of promoters that contain each motif falling within each expression cluster is also shown (right). Expression clusters are grouped and coloured as coded in Fig. 1b. c Sequence logo for an over-represented motif (E-value and number of sites as indicated) in zygotic promoters (tailbud sequences from TCs with dominant CTSS in cluster 0_0) in O. dioica (top), and its alignment to a significant match (E-value and p as indicated) for the binding site motif of human TFAP4. d Heatmap shows the density of the zygotic promoter motif matching TFAP4 at each position (x-axis) in a -500 to +500 bp region centred on the tailbud dominant TSS for zygotic promoter sequences (rows) ordered by promoter width (top to bottom = broad to sharp). Darker blue indicates higher enrichment. e Distance relative to the dominant TSS in day 2 animals for the ACCATAA motif found in sharp promoters that have ubiquitous and day 2-specific expression profiles
Fig. 4
Fig. 4
Features of TATA-dependent promoters in O. dioica. a Percentage of all consensus promoters within each expression cluster (left) (profiles shown in Additional file 1: Figure S2A) containing TATA-elements as labelled (TATAW = core TATA motif; TATA-box = consensus TATA-box). Percentage of promoters that contain TATA-elements within each expression cluster is also shown (right): the majority of TATA-dependent promoters are adult-specific. Expression clusters are grouped and coloured according to colours in Fig. 1b. b-c Plots show the mean log2 ratio of methyl-DNA IP/input (b) or ChIP/input (c) (y-axis) at each probe position (x-axis) in a 1000 bp window centred on the dominant TSS, in ovaries, testes and embryos (tailbud) as labelled. Error bars show 95% confidence intervals for the mean obtained by bootstrapping. Promoters were divided into broad and sharp with sharp subdivided into those with a TATAW-element and those without and, in the testis, those with the position-specific TCTAGA motif. DNA methylation was enriched in the downstream of TATA-dependent promoters (b) and H3K4me2 and H3K4me3 were depleted in the same regions (c)
Fig. 5
Fig. 5
Promoter types in O. dioica. Schematic shows representative features of maternal, zygotic, ubiquitous (and ribosomal protein), tissue-specific and spermatogenic promoters with the key stages of the O. dioica life cycle. Horizontal lines represent positions of CAGE tags to indicate broad (staggered) or sharp (end-aligned) promoter architectures; green ovals represent pre-initiation complex sub-units. Motifs and dinucleotide enrichments are indicated. Brown circles represent positions of nucleosomes: no overlap indicates ordered positioning; question marks indicate lack of data. Trans-splicing with the spliced-leader (SL) at an AG acceptor site is also shown at promoter types where this is common. Boxes represent enrichments of histone modifications across maternal, spermatogenesis and adult promoters: red = enrichment; white = depletion

References

    1. Juven-Gershon T, Kadonaga JT. Regulation of gene expression via the core promoter and the basal transcriptional machinery. Dev Biol. 2010;339(2):225–9. doi: 10.1016/j.ydbio.2009.08.009. - DOI - PMC - PubMed
    1. Lenhard B, Sandelin A, Carninci P. Metazoan promoters: emerging characteristics and insights into transcriptional regulation. Nat Rev Genet. 2012;13(4):233–45. doi: 10.1038/nrg3163. - DOI - PubMed
    1. Ponjavic J, Lenhard B, Kai C, Kawai J, Carninci P, Hayashizaki Y, Sandelin A. Transcriptional and structural impact of TATA-initiation site spacing in mammalian core promoters. Genome Biol. 2006;7(8):78. doi: 10.1186/gb-2006-7-8-r78. - DOI - PMC - PubMed
    1. Haberle V, Li N, Hadzhiev Y, Plessy C, Previti C, Nepal C, Gehrig J, Dong X, Akalin A, Suzuki AM, van IJcken WFJ, Armant O, Ferg M, Strähle U, Carninci P, Muller F, Lenhard B. Two independent transcription initiation codes overlap on vertebrate core promoters. Nature. 2014;507(7492):381–5. doi: 10.1038/nature12974. - DOI - PMC - PubMed
    1. Zemach A, Mcdaniel IE, Silva P, Zilberman D. Genome-Wide Evolutionary Analysis of Eukaryotic DNA Methylation. Science. 2010;328(5980):916–9. doi: 10.1126/science.1186366. - DOI - PubMed

Publication types