. 2018 Feb 26;6(1):41.
doi: 10.1186/s40168-018-0420-9.

Correcting for 16S rRNA gene copy numbers in microbiome surveys remains an unsolved problem

Affiliations

Correcting for 16S rRNA gene copy numbers in microbiome surveys remains an unsolved problem

Stilianos Louca et al. Microbiome. .

Abstract

The 16S ribosomal RNA gene is the most widely used marker gene in microbial ecology. Counts of 16S sequence variants, often in PCR amplicons, are used to estimate proportions of bacterial and archaeal taxa in microbial communities. Because different organisms contain different 16S gene copy numbers (GCNs), sequence variant counts are biased towards clades with greater GCNs. Several tools have recently been developed for predicting GCNs using phylogenetic methods and based on sequenced genomes, in order to correct for these biases. However, the accuracy of those predictions has not been independently assessed. Here, we systematically evaluate the predictability of 16S GCNs across bacterial and archaeal clades, based on ∼ 6,800 public sequenced genomes and using several phylogenetic methods. Further, we assess the accuracy of GCNs predicted by three recently published tools (PICRUSt, CopyRighter, and PAPRICA) over a wide range of taxa and for 635 microbial communities from varied environments. We find that regardless of the phylogenetic method tested, 16S GCNs could only be accurately predicted for a limited fraction of taxa, namely taxa with closely to moderately related representatives (≲15% divergence in the 16S rRNA gene). Consistent with this observation, we find that all considered tools exhibit low predictive accuracy when evaluated against completely sequenced genomes, in some cases explaining less than 10% of the variance. Substantial disagreement was also observed between tools (R2<0.5) for the majority of tested microbial communities. The nearest sequenced taxon index (NSTI) of microbial communities, i.e., the average distance to a sequenced genome, was a strong predictor for the agreement between GCN prediction tools on non-animal-associated samples, but only a moderate predictor for animal-associated samples. We recommend against correcting for 16S GCNs in microbiome surveys by default, unless OTUs are sufficiently closely related to sequenced genomes or unless a need for true OTU proportions warrants the additional noise introduced, so that community profiles remain interpretable and comparable between studies.

Keywords: 16S rRNA; Gene copy number; Microbiome surveys; Phylogenetic reconstruction.


Conflict of interest statement

Ethics approval and consent to participate

Not applicable.

Consent for publication

Not applicable.

Competing interests

The authors declare that they have no competing interests.

Publisher’s Note

Springer Nature remains neutral with regard to jurisdictional claims in published maps and institutional affiliations.

Figures

Fig. 1
Fig. 1
Phylogenetic signal of 16S gene copy numbers (SILVA-derived tree). a Pearson autocorrelation function of 16S GCNs depending on phylogenetic distance between tip pairs, estimated based on ∼ 6,800 sequenced genomes. b Distances of tips in the SILVA-derived tree to the nearest sequenced genome. Each bar spans an NSTD interval of 2%. c Cross-validated coefficients of determination (Rcv2) for 16S GCNs predicted on the SILVA-derived tree and depending on the minimum NSTD of the tips tested, for various ancestral state reconstruction algorithms (PIC: phylogenetic independent contrasts, WSCP: weighted squared-change parsimony, SA: subtree averaging, MPR: maximum parsimony reconstruction, Mk: continuous-time Markov chain model with equal-rates transition matrix). MPR transition costs either increased exponentially with transition size (“exp”), proportionally to transition size (“pr”), or were equal for all transitions (“ae”). For analogous results using the original SILVA tree, see Additional file 1: Figure S1
Fig. 2
Fig. 2
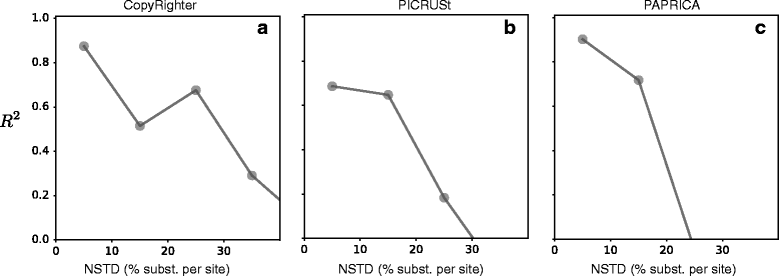
Evaluation of GCN prediction tools on genomes with known GCNs. Accuracy of GCN predictions by CopyRighter (a; [7]), PICRUSt (b; [6]), and PAPRICA (c; [8]) for sequenced genomes, as a function of the genome’s NSTD. NSTDs were calculated separately for each tool, based on the set of genomes used to calibrate the tool by its authors. Accuracy was measured in terms of the coefficient of determination, i.e. the fraction of variance in true GCNs explained by each tool (R2). Genomes were binned into equally sized NSTD intervals (i.e., 0–10%, 10–20% etc.), and the R2 was calculated separately for genomes in each bin (one plotted point per bin). Only bins with at least 10 genomes are shown
Fig. 3
Fig. 3
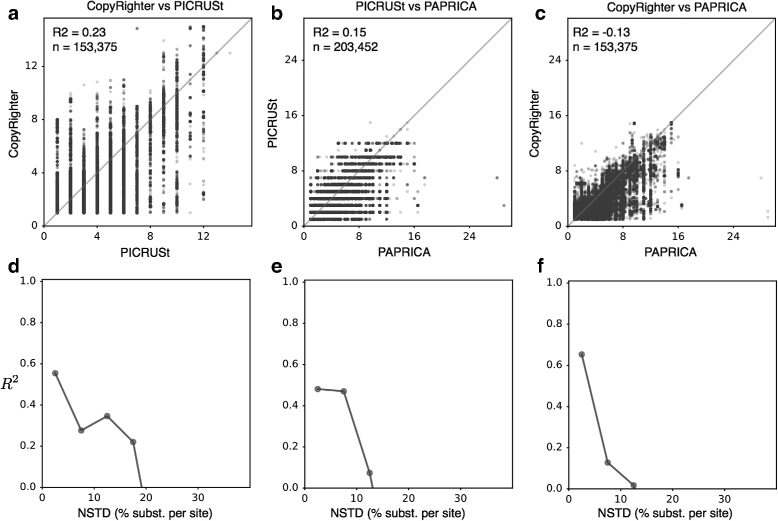
Comparisons of 16S GCN predictions between tools across Greengenes. a 16S GCNs predicted by CopyRighter (vertical axis; [7]) and PICRUSt (horizontal axis; [6]) across OTUs (99% similarity) in the Greengenes 16S rRNA reference database (release May 2013; [20]). One point per OTU. b Comparison of predicted 16S GCNs by PICRUSt and PAPRICA, similarly to (a). c Comparison of predicted 16S GCNs by CopyRighter and PAPRICA, similarly to (a). Diagonal lines are shown for reference. Fractions of explained variance (R2, X-axis explaining Y-axis) and the number of considered OTUs (n) are written in each figure. d–f Fractions of explained variance (R2) as a function of an OTU’s NSTD, for each compared pair of tools in a–c. OTUs were binned into equally sized NSTD intervals (i.e., 0–5%, 5–10% etc.), and the R2 was calculated separately for OTUs in each bin (one plotted point per bin). Only bins with at least 10 OTUs are shown
Fig. 4
Fig. 4
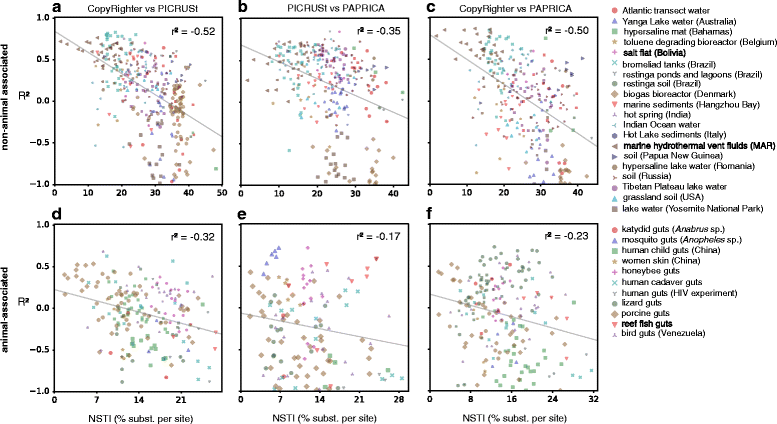
Agreement of GCN prediction tools in microbial communities, depending on the NSTI. a Agreement between 16S GCNs predicted by CopyRighter and PICRUSt (in terms of the fraction of variance in the former explained by the latter, R2) for non-animal-associated microbial communities, compared to the nearest sequenced taxon index (NSTI) of each community. Each point represents the R2 and the NSTI of one microbial community sample. b, c Similar to a, but comparing PICRUSt to PAPRICA (b) and CopyRighter to PAPRICA (c). d–f Similar to a–c, but showing animal-associated samples. In all figures, linear regression lines are shown for reference. Pearson correlations between R2 and NSTI (r2, written in each figure) were statistically significant (P<0.05) in all cases. Points are shaped and colored according to the original study, as listed in the legend. Note the negative relationship between a community’s NSTI and the pairwise agreement of GCN prediction tools for that community. For a similar figure showing the spread of NSTDs in each sample, see Additional file 1: Figures S5. For detailed comparisons between tools on individual samples see Additional file 1: Figures S6 and S7

References

    1. Turnbaugh PJ, Ley RE, Hamady M, Fraser-Liggett CM, Knight R, Gordon JI. The human microbiome project. Nature. 2007;449(7164):804–10. doi: 10.1038/nature06244. - DOI - PMC - PubMed
    1. Gilbert JA, Jansson JK, Knight R. The Earth Microbiome project: successes and aspirations. BMC Biol. 2014;12(1):69. doi: 10.1186/s12915-014-0069-1. - DOI - PMC - PubMed
    1. Lima-Mendez G, Faust K, Henry N, Decelle J, Colin S, Carcillo F, Chaffron S, Ignacio-Espinosa JC, Roux S, Vincent F, Bittner L, Darzi Y, Wang J, Audic S, Berline L, Bontempi G, Cabello AM, Coppola L, Cornejo-Castillo FM, d’Ovidio F, De Meester L, Ferrera I, Garet-Delmas MJ, Guidi L, Lara E, Pesant S, Royo-Llonch M, Salazar G, Sánchez P, Sebastian M, Souffreau C, Dimier C, Picheral M, Searson S, Kandels-Lewis S, coordinators TO, Gorsky G, Not F, Ogata H, Speich S, Stemmann L, Weissenbach J, Wincker P, Acinas SG, Sunagawa S, Bork P, Sullivan MB, Karsenti E, Bowler C, de Vargas C, Raes J. Determinants of community structure in the global plankton interactome. Science. 2015;348(6237):1262073. doi: 10.1126/science.1262073. - DOI - PubMed
    1. Quast C, Pruesse E, Yilmaz P, Gerken J, Schweer T, Yarza P, Peplies J, Glöckner FO. The SILVA ribosomal RNA gene database project: improved data processing and web-based tools. Nucleic Acids Res. 2013;41(D1):590–6. doi: 10.1093/nar/gks1219. - DOI - PMC - PubMed
    1. Kembel SW, Wu M, Eisen JA, Green JL. Incorporating 16S gene copy number information improves estimates of microbial diversity and abundance. PLOS Comput Biol. 2012;8(10):1–11. doi: 10.1371/journal.pcbi.1002743. - DOI - PMC - PubMed

Publication types

Substances