. 2018 May;8(5):600-615.
doi: 10.1158/2159-8290.CD-17-0935. Epub 2018 Feb 26.

Genomic and Functional Fidelity of Small Cell Lung Cancer Patient-Derived Xenografts

Affiliations

Genomic and Functional Fidelity of Small Cell Lung Cancer Patient-Derived Xenografts

Benjamin J Drapkin et al. Cancer Discov. 2018 May.

Abstract

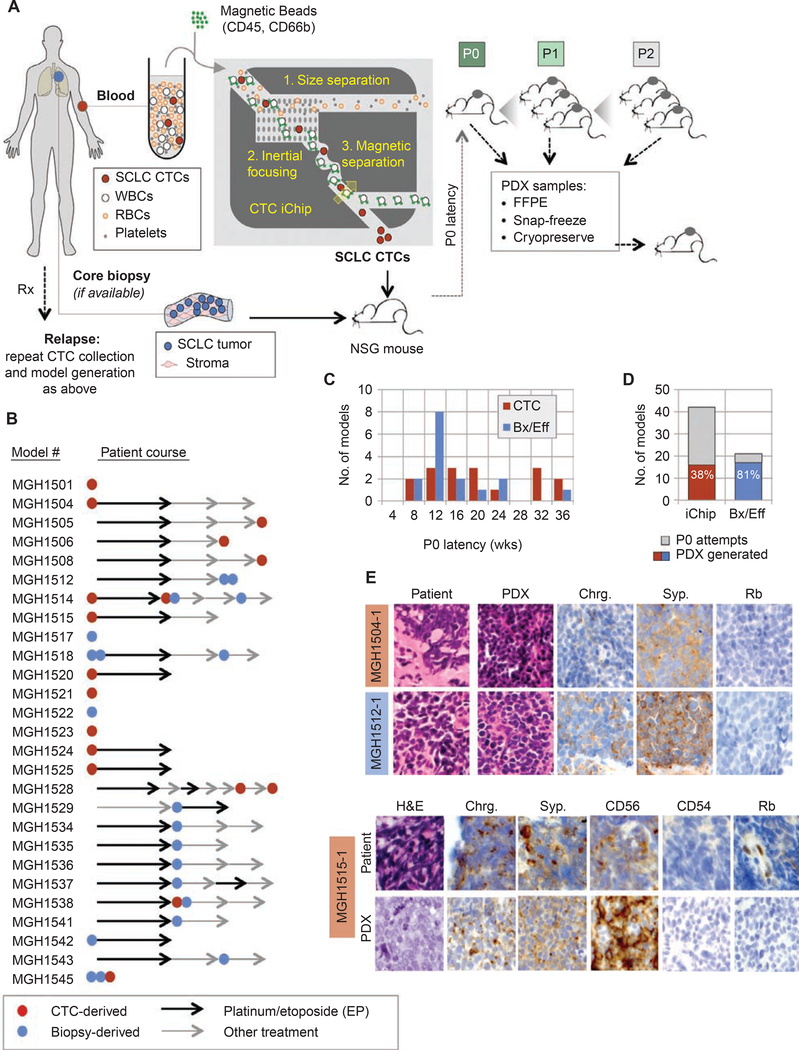
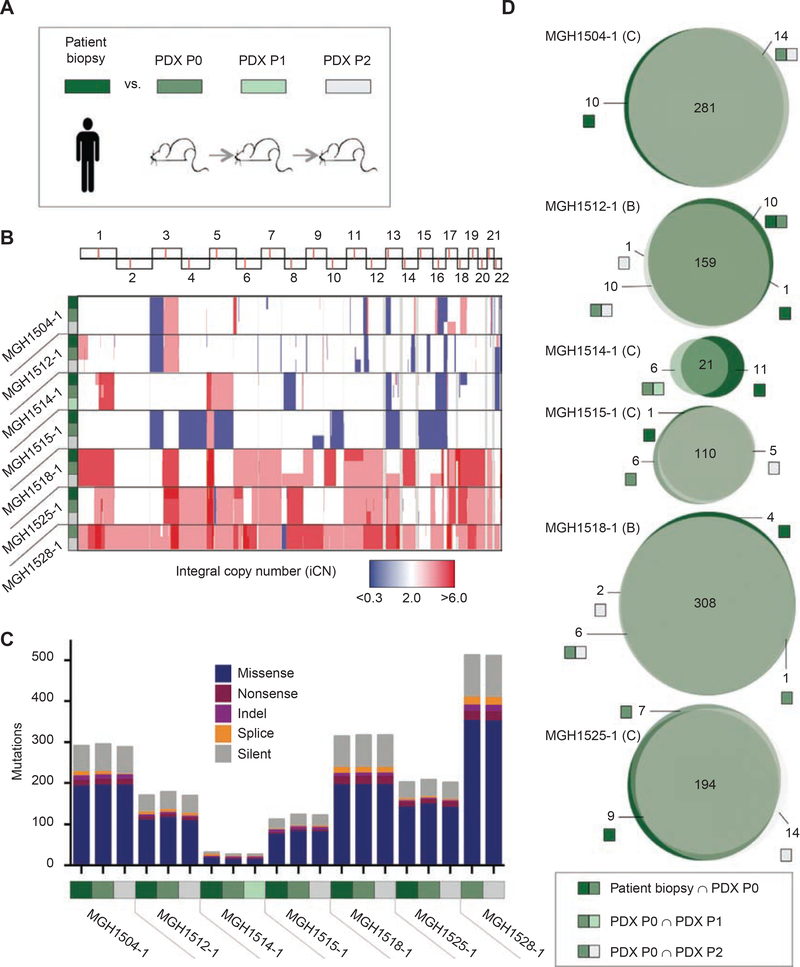
Small cell lung cancer (SCLC) patient-derived xenografts (PDX) can be generated from biopsies or circulating tumor cells (CTC), though scarcity of tissue and low efficiency of tumor growth have previously limited these approaches. Applying an established clinical-translational pipeline for tissue collection and an automated microfluidic platform for CTC enrichment, we generated 17 biopsy-derived PDXs and 17 CTC-derived PDXs in a 2-year timeframe, at 89% and 38% efficiency, respectively. Whole-exome sequencing showed that somatic alterations are stably maintained between patient tumors and PDXs. Early-passage PDXs maintain the genomic and transcriptional profiles of the founder PDX. In vivo treatment with etoposide and platinum (EP) in 30 PDX models demonstrated greater sensitivity in PDXs from EP-naïve patients, and resistance to EP corresponded to increased expression of a MYC gene signature. Finally, serial CTC-derived PDXs generated from an individual patient at multiple time points accurately recapitulated the evolving drug sensitivities of that patient's disease. Collectively, this work highlights the translational potential of this strategy.Significance: Effective translational research utilizing SCLC PDX models requires both efficient generation of models from patients and fidelity of those models in representing patient tumor characteristics. We present approaches for efficient generation of PDXs from both biopsies and CTCs, and demonstrate that these models capture the mutational landscape and functional features of the donor tumors. Cancer Discov; 8(5); 600-15. ©2018 AACR.This article is highlighted in the In This Issue feature, p. 517.


Conflict of interest statement

Disclosure of Potential Conflicts of Interest

B.J. Drapkin reports receiving commercial research support from Novartis. M. Mino-Kenudson is a consultant/advisory board member for H3 Biomedicine and Merrimack Pharmaceuticals. S. Lakis is a consultant/advisory board member for BioNTech Diagnostics. R.S. Heist is a consultant/advisory board member for Boehringer Ingelheim. R. Büttner is a consultant/advisory board member for AbbVie. L. V. Sequist is a consultant/advisory board member for AstraZeneca, Boehringer Ingelheim, Genentech, Merrimack, Novartis, and Pfizer. A.N. Hata reports receiving commercial research grants from Amgen, Novartis, and Relay Therapeutics. S. Maheswaran has applied for patent protection for the CTC isolation technology. D.A. Haber has applied for patent protection for the CTC isolation technology. N. Dyson reports receiving commercial research support from Novartis. R.K. Thomas reports receiving a commercial research grant from Roche; has received honoraria from the speakers bureaus of AstraZeneca, Boehringer Ingelheim, Clovis, Daiichi-Sankyo, Lilly, Merck, MSD, Puma, and Roche; and is a consultant/advisory board member for Neo New Oncology GmbH. A.F. Farago reports receiving commercial research support from AbbVie, AstraZeneca, Novartis, PharmaMar, Loxo Oncology, Ignyta, Merck, and Bristol-Myers Squibb; has received honoraria from the speakers bureau of Foundation Medicine; and is a consultant/advisory board member of AbbVie, PharmaMar, Loxo, Takeda, and Merrimack. No potential conflicts of interest were disclosed by the other authors.

Figures

Figure 1.
Figure 1.
Generation of a population of SCLC PDX models. A, Strategy for SCLC PDX development. PDX models were initiated from whole blood via CTC isolation (red, top), core tumor biopsies (blue, bottom), or effusion specimens. Whole blood samples were processed via the CTC-iChipneg device, which enriches CTCs in a three-step process: (1) separation of nonnucleated cells and plasma by size hydrodynamic diameter using a microarray of posts, (2) inertial focusing through an asymmetric serpentine channel to position cells in a single line, and (3) negative selection of leukocytes decorated with anti-CD45/CD66b magnetic beads by magnetic separation (yellow arrow = magnetic deflection). Biopsy, effusion, and CTC samples were injected s.c. into the flanks of NSG mice, monitored for tumor emergence (P0 latency), and then serially passaged (P1, P2). Tumor samples were obtained for molecular and pathologic analysis and for cryopreservation of the model. B, Panel of SCLC PDX models with abstracted patient clinical courses. Models derived from either CTCs (red circles) or biopsies/effusions (blue circles) were generated at various time points throughout the treatment of the patient (arrows). Arrows are not drawn to scale with respect to time on treatments. C, Latency to (P0) tumor emergence for models initiated from June 2014 to June 2016. D, Efficiency of PDX generation from CTCs and biopsies (Bx)/effusions (Eff). Total attempts in gray, successful in color. E, Pathologic confirmation of SCLC. Shown are SCLC histology (hematoxylin and eosin staining) comparison between biopsy and PDX derived from either CTCs (MGH1504–1) or biopsy (MGH1512–1), as well as IHC stains for neuroendocrine markers and of nuclear RB1. Direct comparison of histology and IHC stains in a patient sample and corresponding CTC-derived PDX model (MGH1515–1) are also shown. Additional examples are shown in Supplementary Fig. S1. Chrg., chromogranin; FFPE, formalin-fixed, paraffin embedded; RBC, red blood cell; Syp., synaptophysin; WBC, white blood cell.
Figure 2.
Figure 2.
Genomic alterations and expression profiles in SCLC PDX models. A, Spectrum of genomic alterations in the panel of 7 PDX models. Top plot, biallelic genomic inactivation of TP53 and RB1. Bottom plot, notable alterations in PDX models beyond TP53 and RB1 referring to previously identified significantly mutated genes in SCLC (*; ref. 22) and to mutated cancer census genes of therapeutic relevance (#). The bottom plot displays the type of base-pair substitution referring to the representative data of PDX P0 (Supplementary Table S2). B, Detection of the out-of-frame fusion transcript TP53-ITNL2 in MGH1514–1 by paired-end RNA sequencing (RNA-seq). C, Pearson correlation matrix for passage 0 and passage 1–2 tumors from each model, using genes with highly variable transcription levels across all samples (max RPKM > 3, coefficient of variation > 1, 1,568 transcripts). Source of each PDX model (C, CTC; B, biopsy) is indicated in parentheses next to the model number. D, Clustering analysis on transcriptome sequencing data of PDX models (n = 13 from 7 patients) and human SCLC tumors (n = 20, from ref. 22) selected to represent the neuroendocrine-high and -low groups as previously described. Clustering performed on genes that distinguish human primary tumors to avoid signatures associated with human immune and stromal infiltrates. All data processed with RNA-seq pipeline for human+mouse reads.
Figure 3.
Figure 3.
High genomic fidelity of SCLC PDX models derived from both CTCs and biopsies. A, Comparative genomic analysis on patient biopsy vs. PDX P0 and subsequently passaged PDX tumors (P1 for MGH1514–1 or P2 for all other models). B and C, Analysis of the copy-number alteration status (B) and of the number and type of somatic mutations (C) is displayed for six models. Initial tumor biopsy and derivative PDX models are described according to the color panel provided in A. D, Venn diagrams show overlap of mutations between patient biopsy, PDX P0 and PDX P1/2 exomes. Diagrams are colored according to the annotation in A and are scaled to total number of mutations. Number of private mutations not shared by all three samples is shown in side of the diagrams, with color bar below indicating the sample(s). Source of each PDX model (C, CTC; B, biopsy) is indicated in parentheses next to the model number.
Figure 4.
Figure 4.
SCLC PDX model responses to first-line chemotherapy reflect patient treatment histories. A, % ITV vs. days after EP start for a single xenograft treated with two 1-week cycles of cisplatin 7 mpk i.p. d1 + etoposide 10 mpk i.p. d1–3 (tan bars). Response = minimum %ITV between d14 and d28. TTP = time to 2x ITV. B, Differential EP response of serial models from patient MGH1518 derived before first-line chemotherapy and after second-line therapy. C, Trial of EP across a population of 30 PDX models: 12 from treatment-naïve patients (green) and 18 from previously treated patients (purple). Results presented in D-O, with same green/purple color code in E-I and L. D, Correlation of PDX EP response and TTP. E, Waterfall plot of PDX best response. F-H, Comparison of tumor metrics following EP treatment in PDX models from treatment-naïve vs. post-relapse patients, with unpaired t test P values: best response (F), doubling time (G), and ratio of TTP to doubling time (H). I, TTP in post-relapse PDX models vs. EP TTP in the donor patients. J, Correlation of SLFN transcript abundance in transcriptome sequencing (TPM), and protein levels measured by quantitative Western blot (arbitrary units) across 19 models, with logarithmic trend line. K, Lack of correlation between EP response (rank 1 = deepest response) and SLFN11 expression (rank 1 = highest level): protein on left (30 models), transcript on right (19 models). L, No difference in SLFN11 protein levels between PDX models from treatment-naïve vs. post-relapse patients. M, Gene set enrichment analysis (GSEA) of transcripts that correlate with PDX EP resistance (Spearman ρ > 0.6) using “Hallmark” gene sets (MSigDB v6.0). Gene sets with FDR of less than 1% are shown. N, 200 putative MYC targets that correlate with GSEA MYC signature were compared with inventory of chromatin immunoprecipitation sequencing (ChIP-seq) datasets. A total of 807 datasets from ENCODE, covering 181 transcription factors (TF), had >1 intersecting gene. Inset: top enriched TFs for these genes, with a Kolmogorov-Smirnov (KS) statistic P value < 0.01. O, MYC regulon correlates with EP resistance. MYC regulon = 155/200 putative MYC targets that were present in top 7 MYC/MAX ChIP-seq dataset. Regulon expression rank vs. EP response rank for 19 PDX models.
Figure 5.
Figure 5.
SCLC PDX models recapitulate patient responses to an experimental therapy. A, Axial CT scan ¡mages from patient MGH1528 at multiple time points: immediately before starting treatment on olaparib + temozolomide (OT; left), during treatment at nadir of response (middle), and at the time of progression (right). The schematic above indicates prior lines of therapy, with carboplatin + etoposide (EC) shown in black arrows, other therapies shown in gray arrows, and OT shown as an orange arrow. Arrows are not drawn to scale with respect to time on treatments. B, PDX models generated from patient MGH1528 prior to OT (MGH1528–1) and at the time of progression (MGH1528–2) were treated with OT (blue) or vehicle (gray) for one cycle (5 days, blue shading). Tumor dimensions were measured 3 times per week and plotted as percent ITV vs. time. C, STCs generated from untreated PDX tumors were treated with OT combinations in vitro. Cultures were seeded on the day of tumor extraction (day 0), treatment was initiated within 24 hours (day 1), and viability was assayed after 5 days of treatment (day 6). Olaparib doses (9) range from 10 nmol/L to 10 μmol/L and temozolomide doses (5) from 1 to 300 μmol/L, both on exponential scales.

References

    1. Pietanza MC, Byers LA, Minna JD, Rudin CM. Small cell lung cancer: will recent progress lead to improved outcomes? Clin Cancer Res 2015;21:2244–55. - PMC - PubMed
    1. Jalal SI, Lavin P, Lo G, Lebel F, Einhorn L. Carboplatin and etoposide with or without palifosfamide in untreated extensive-stage small-cell lung cancer: a multicenter, adaptive, randomized phase III study (MATISSE). J Clin Oncol 2017;35:2619–23. - PubMed
    1. Tiseo M, Boni L, Ambrosio F, Camerini A, Baldini E, Cinieri S, et al. Italian, multicenter, phase III, randomized study of cisplatin plus etoposide with or without bevacizumab as first-line treatment in extensive-disease small-cell lung cancer: the GOIRC-AIFA FARM6P- MFJM Trial. J Clin Oncol 2017;35:1281–7. - PubMed
    1. Reck M, Luft A, Szczesna A, Havel L, Kim SW, Akerley W, et al. Phase III randomized trial of ipilimumab plus etoposide and platinum versus placebo plus etoposide and platinum in extensive-stage small-cell lung cancer. J Clin Oncol 2016;34:3740–8. - PubMed
    1. Gardner EE, Lok BH, Schneeberger VE, Desmeules P, Miles LA, Arnold PK, et al. Chemosensitive relapse in small cell lung cancer proceeds through an EZH2-SLFN11 axis. Cancer Cell 2017;31:286–99. - PMC - PubMed

Publication types