. 2018 Mar 20;115(12):3072-3077.
doi: 10.1073/pnas.1716137115. Epub 2018 Feb 26.

Convergence of marine megafauna movement patterns in coastal and open oceans

Affiliations

Convergence of marine megafauna movement patterns in coastal and open oceans

A M M Sequeira et al. Proc Natl Acad Sci U S A. .

Abstract

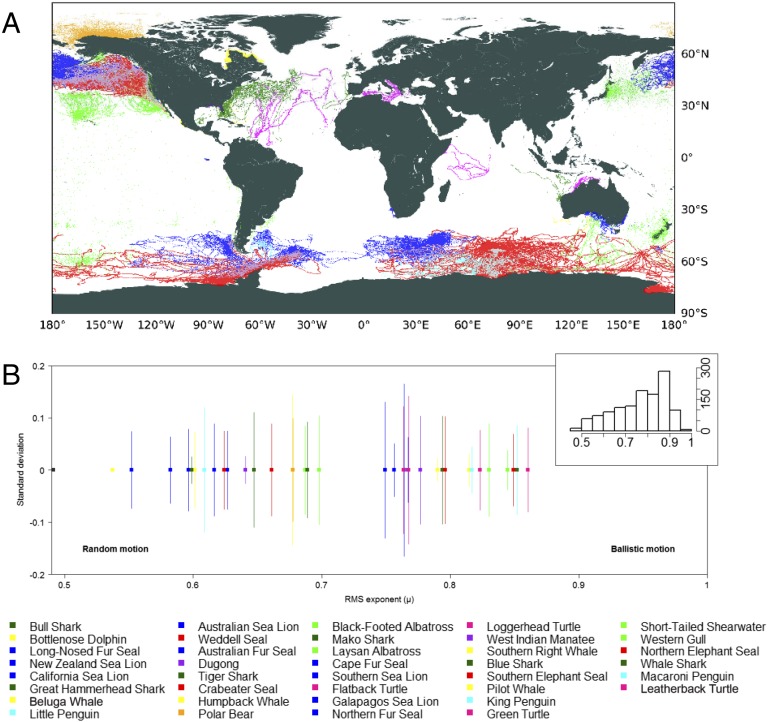
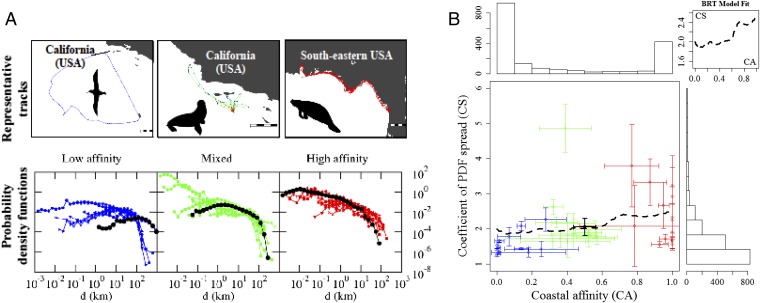
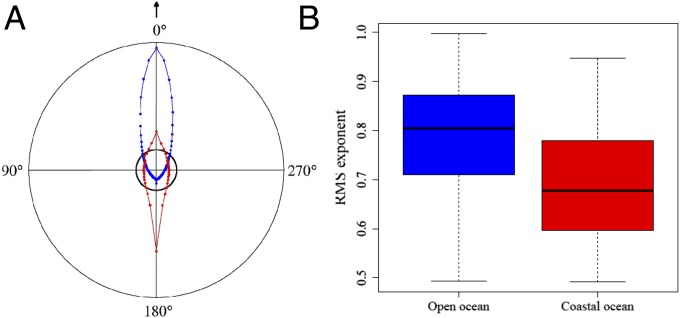
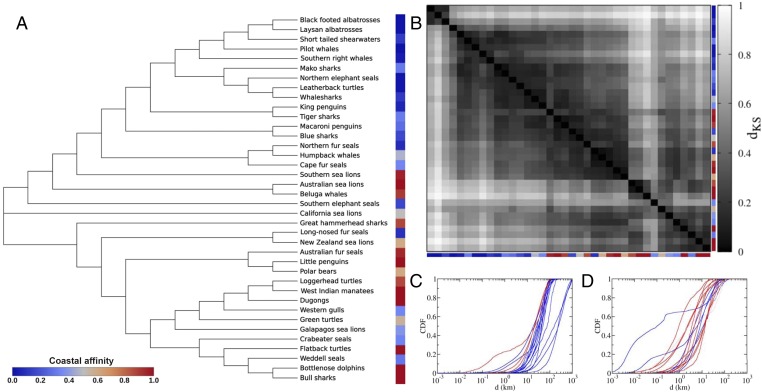
The extent of increasing anthropogenic impacts on large marine vertebrates partly depends on the animals' movement patterns. Effective conservation requires identification of the key drivers of movement including intrinsic properties and extrinsic constraints associated with the dynamic nature of the environments the animals inhabit. However, the relative importance of intrinsic versus extrinsic factors remains elusive. We analyze a global dataset of ∼2.8 million locations from >2,600 tracked individuals across 50 marine vertebrates evolutionarily separated by millions of years and using different locomotion modes (fly, swim, walk/paddle). Strikingly, movement patterns show a remarkable convergence, being strongly conserved across species and independent of body length and mass, despite these traits ranging over 10 orders of magnitude among the species studied. This represents a fundamental difference between marine and terrestrial vertebrates not previously identified, likely linked to the reduced costs of locomotion in water. Movement patterns were primarily explained by the interaction between species-specific traits and the habitat(s) they move through, resulting in complex movement patterns when moving close to coasts compared with more predictable patterns when moving in open oceans. This distinct difference may be associated with greater complexity within coastal microhabitats, highlighting a critical role of preferred habitat in shaping marine vertebrate global movements. Efforts to develop understanding of the characteristics of vertebrate movement should consider the habitat(s) through which they move to identify how movement patterns will alter with forecasted severe ocean changes, such as reduced Arctic sea ice cover, sea level rise, and declining oxygen content.

Keywords: displacements; global satellite tracking; probability density function; root-mean-square; turning angles.


Conflict of interest statement

The authors declare no conflict of interest.

Figures

Fig. 1.
Fig. 1.
Representation of the global tracking dataset and scaling properties for all species analyzed. (A) Global map with trajectories obtained by satellite tracking for all 50 species. (B) The scaling exponents (μ) obtained from the root-mean-square (dRMS) analysis of displacements for all species analyzed (species names indicated from left to right in caption; squares indicate mean values, and bars show the SD). Histogram in Inset shows the number of individuals for the range of scaling exponents. Long-nosed fur seal: common name for the South Australian population of New Zealand fur seal. Colors represent each of the nine guilds with data: cetaceans (yellow), eared seals (blue), flying birds (green), penguins (cyan), polar bears (orange), sharks (dark green), sirenians (purple), true seals (red), and turtles (pink).
Fig. 2.
Fig. 2.
Results of the analysis of displacements. (A) PDF of displacements (d, km) at the species level with 1-d time windows for species with low (mean < 0.3; Left), mixed (Center), and high (mean > 0.7; Right) coastal affinity (Bottom), and example tracks for each group (Top; black and white scale bars represent 100 km; black dotted lines: PDF for the example track shown). (B) Relationship between coefficient of PDF spread (CS) and coastal affinity (CA) obtained from the BRTs (dashed black line; also shown in the Top Right Inset). To the top and right are histograms of CA and CS, respectively. Outlier green point: western gulls (0 ≤ CA ≤ 1; SI Appendix, Table S4). Average coefficients of variation: 22.94%, 38.10%, and 40.37% for CS, and 243.55%, 85.93%, and 11.48% for CA for low (blue), mixed (green), and high (red) CA species, respectively. Solid black: mean ± SD among all species with a coefficient of variation of 37.20% for CS and 39.51% CA.
Fig. 3.
Fig. 3.
Comparison of movement patterns in open and coastal oceans. The classification into open or coastal was based on the depth at which the displacements occurred with depth ≤ 150 m classified as coastal ocean. (A) Distribution of turning angles (arrow points to 0°) in open (blue) and coastal oceans (red). The circular plot reveals high frequency of 0° angles in open ocean and a large number of angles between 90° and 270° angles (peaking at 180°; i.e., returns) in coastal oceans. Black inner circle: uniform distribution of angles. (B) Boxplot of dRMS exponents (μ) for individuals showing coastal affinity below (blue) and above (red) 0.5 (μ = 0.784–0.085 × coastal ocean; P < 0.001).
Fig. 4.
Fig. 4.
Analysis of distances between the CDFs of displacements for each pair of species. The colors shown correspond to the classification of each species as having high (red) or low coastal affinity (blue) based on the proportion of their observed displacements occurring completely within coastal ocean for each individual of the same species (SI Appendix, Table S4). (A) Dendrogram obtained from the distance matrix derived from the Kolmogorov–Smirnov analysis showing two main branches (anchored by the line for California sea lions) broadly associated with low (<0.5; upper branch) and high (>0.5, lower branch) coastal affinity. (B) Distance matrix (mirror image from diagonal) with darker colors indicating short distances (dKS) between the species’ CDFs. C and D show the CDF of displacements for species in the upper and lower branch of the dendrogram, respectively, highlighting distinct displacement regions (d in the x axis) for the curves relative to species occurring mostly on open and coastal oceans, respectively.

References

    1. Stearns SC. Life-history tactics: A review of the ideas. Q Rev Biol. 1976;51:3–47. - PubMed
    1. Charnov EL. Optimal foraging, the marginal value theorem. Theor Popul Biol. 1976;9:129–136. - PubMed
    1. Stephens D, Krebs J. Foraging Theory. Princeton Univ Press; Princeton: 1986.
    1. Schmidt-Nielsen K. Locomotion: Energy cost of swimming, flying, and running. Science. 1972;177:222–228. - PubMed
    1. Brown JH, Gillooly JF, Allen AP, Savage VM, West GB. Toward a metabolic theory of ecology. Ecology. 2004;85:1771–1789.

Publication types