. 2018 Mar 13;115(11):2752-2757.
doi: 10.1073/pnas.1708856115. Epub 2018 Feb 26.

Forecasting the spatial transmission of influenza in the United States

Affiliations

Forecasting the spatial transmission of influenza in the United States

Sen Pei et al. Proc Natl Acad Sci U S A. .

Abstract

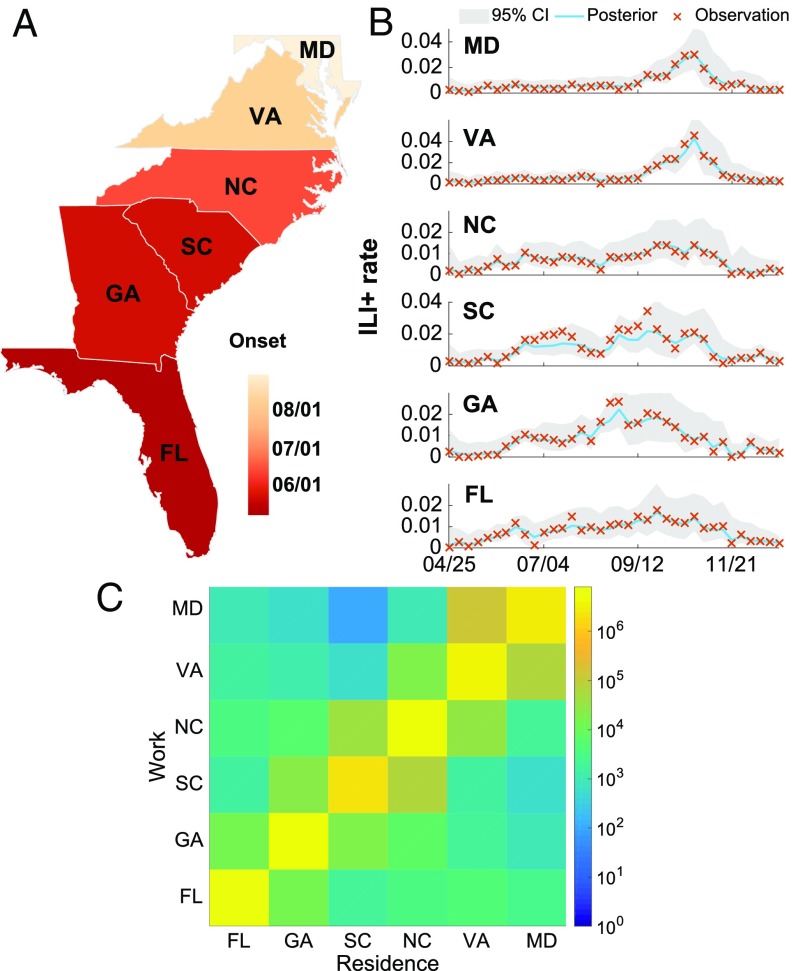
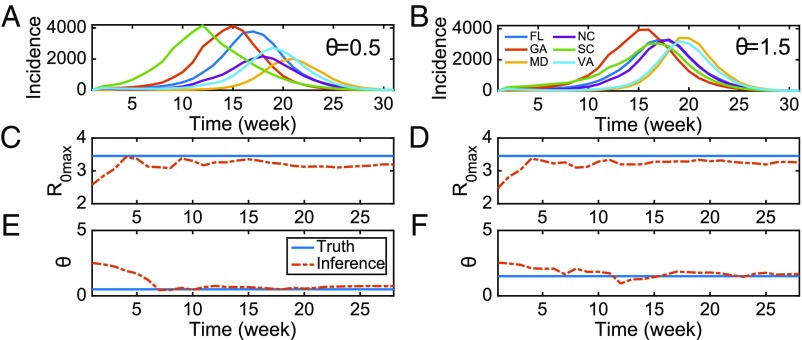
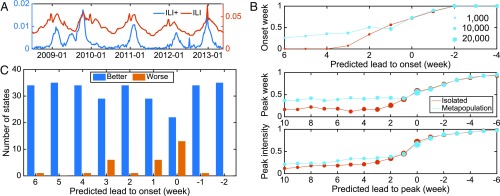
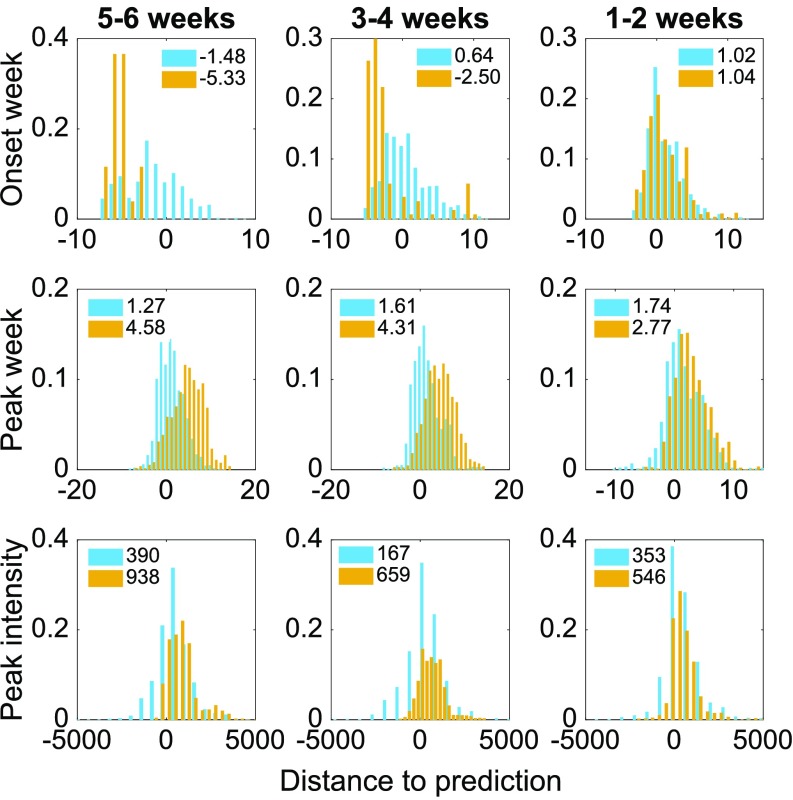
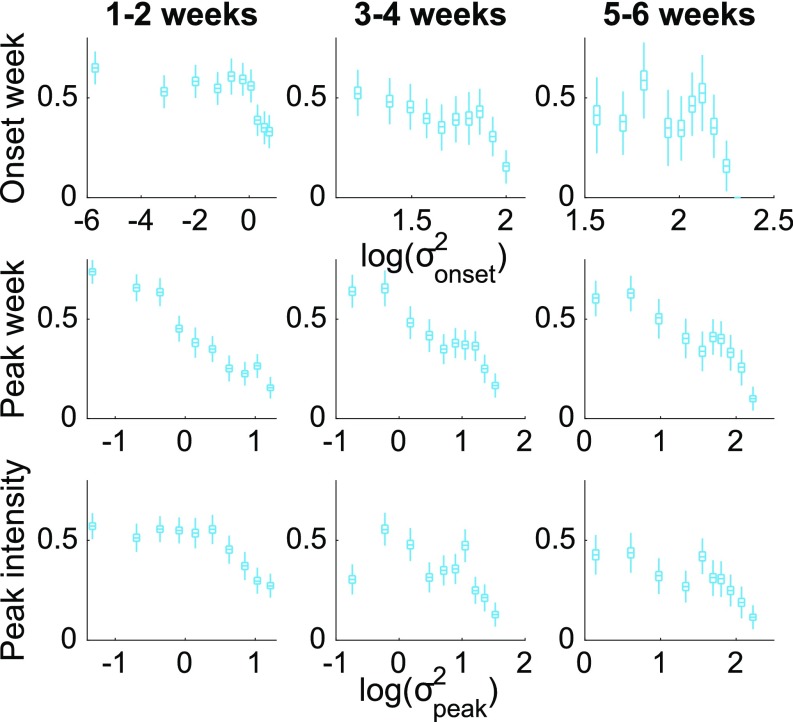
Recurrent outbreaks of seasonal and pandemic influenza create a need for forecasts of the geographic spread of this pathogen. Although it is well established that the spatial progression of infection is largely attributable to human mobility, difficulty obtaining real-time information on human movement has limited its incorporation into existing infectious disease forecasting techniques. In this study, we develop and validate an ensemble forecast system for predicting the spatiotemporal spread of influenza that uses readily accessible human mobility data and a metapopulation model. In retrospective state-level forecasts for 35 US states, the system accurately predicts local influenza outbreak onset,-i.e., spatial spread, defined as the week that local incidence increases above a baseline threshold-up to 6 wk in advance of this event. In addition, the metapopulation prediction system forecasts influenza outbreak onset, peak timing, and peak intensity more accurately than isolated location-specific forecasts. The proposed framework could be applied to emergent respiratory viruses and, with appropriate modifications, other infectious diseases.

Keywords: data assimilation; human mobility; influenza forecast; metapopulation model; spatial transmission.


Conflict of interest statement

Conflict of interest statement: J.S. discloses partial ownership of SK Analytics. S.P., S.K., and W.Y. disclose consultation for SK Analytics.

Figures

Fig. 1.
Fig. 1.
The spatial transmission of influenza along the east coast of the United States during the 2009 pandemic season. (A) Onset date in six states: Florida (FL), Georgia (GA), South Carolina (SC), North Carolina (NC), Virginia (VA), and Maryland (MD). (B) Weekly ILI+ rates (cross symbols) for each state. The solid lines and shaded areas are the posterior mean and 95% credible intervals (CI), respectively, of the metapopulation model–EAKF fit. The states are arranged by geographical location from south (bottom) to north (top). (C) Numbers of recurrent commuters between the six states.
Fig. 2.
Fig. 2.
Inference of key parameters in the metapopulation model. (A and B) Weekly incidence of new infections generated by the metapopulation model for six states (FL, GA, MD, NC, SC, and VA). Both simulations were generated with the same initial conditions, except for (A) θ=0.5 and (B) θ=1.5. Epidemic curves for different states are distinguished with distinct colors. (C θ=0.5; and D θ=1.5) Inference of R0max (the maximal basic reproductive number) using the metapopulation model–EAKF system. The solid blue line indicates the true parameter used in synthetic outbreaks, and the red dashed line represents the posterior mean during data assimilation. (E θ=0.5; and F θ=1.5) Inference of the parameter θ (random movement ratio) in the metapopulation system.
Fig. 3.
Fig. 3.
Forecasting the spatial transmission of type A influenza in the United States. (A) ILI+ (blue color) and ILI (red color) curves at the national level. (B) Average forecast accuracy of onset week, peak week, and peak intensity for both metapopulation and isolated forecasts, across 35 states and five seasons. The y axis scale indicates the fraction of accurate predictions within each group. Symbol size reflects the total number of forecasts in each group in a linear scale. (C) Performance of the metapopulation forecasts by onset week prediction compared with the isolated forecasts in individual states. The blue (orange) bars indicate the number of states where the metapopulation forecast is better (worse).
Fig. 4.
Fig. 4.
Distributions of the distance from the observed targets to the predicted values. The blue bars represent metapopulation forecasts; the orange ones represent the isolated forecasts. The mean bias of each distribution is displayed in the legend of each subplot. (Top) For onset forecasts with predicted leads of 5 to 6, 3 to 4, and 1 to 2 wk, the distributions of the observed onset week with respect to the predicted values (x axis is the value of observed onset week minus predicted onset week) across all 35 states and five seasons are displayed, for both the metapopulation and isolated forecasts. (Middle and Bottom) Same analysis for (Middle) peak week and (Bottom) peak intensity, grouped by the predicted lead to peak. The x axis for Bottom is the value of observed peak intensity (incidence per 100,000 people) minus predicted peak intensity.
Fig. 5.
Fig. 5.
Forecast accuracy calibrated by the ensemble variance. (Top) For each group of onset forecasts with predicted leads of 1 to 2, 3 to 4, and 5 to 6 wk, forecast accuracy is plotted as a function of the ensemble predicted onset variance log transformed, log(σonset2). Forecasts in each group are divided into 10 data bins with same number of forecasts. Box plots indicate bootstrap confidence intervals [box, interquartile (IQR, Q1 to Q3); whisker, Q1 to Q1 - 1.5 × IQR and Q3 to Q3 + 1.5 × IQR] obtained with 105 bootstrap resampling of the forecasts (SI Appendix, Bootstrap Confidence Interval). (Middle and Bottom) Same analysis for (Middle) peak week and (Bottom) peak intensity, but grouped by the predicted lead to peak and calibrated by the ensemble predicted peak variance log transformed, log(σpeak2).

References

    1. Viboud C, et al. Synchrony, waves, and spatial hierarchies in the spread of influenza. Science. 2006;312:447–451. - PubMed
    1. Gog JR, et al. Spatial transmission of 2009 pandemic influenza in the US. PLoS Comput Biol. 2014;10:e1003635. - PMC - PubMed
    1. Charu V, et al. Human mobility and the spatial transmission of influenza in the United States. PLoS Comput Biol. 2017;13:e1005382. - PMC - PubMed
    1. Colizza V, Barrat A, Barthélemy M, Vespignani A. The role of the airline transportation network in the prediction and predictability of global epidemics. Proc Natl Acad Sci USA. 2006;103:2015–2020. - PMC - PubMed
    1. Balcan D, et al. Multiscale mobility networks and the spatial spreading of infectious diseases. Proc Natl Acad Sci USA. 2009;106:21484–21489. - PMC - PubMed

Publication types

LinkOut - more resources