. 2018 Apr 30;38(10):e00677-17.
doi: 10.1128/MCB.00677-17. Print 2018 May 15.

Peroxisome Proliferator-Activated Receptor γ and Its Role in Adipocyte Homeostasis and Thiazolidinedione-Mediated Insulin Sensitization

Affiliations

Peroxisome Proliferator-Activated Receptor γ and Its Role in Adipocyte Homeostasis and Thiazolidinedione-Mediated Insulin Sensitization

Qiong A Wang et al. Mol Cell Biol. .

Abstract

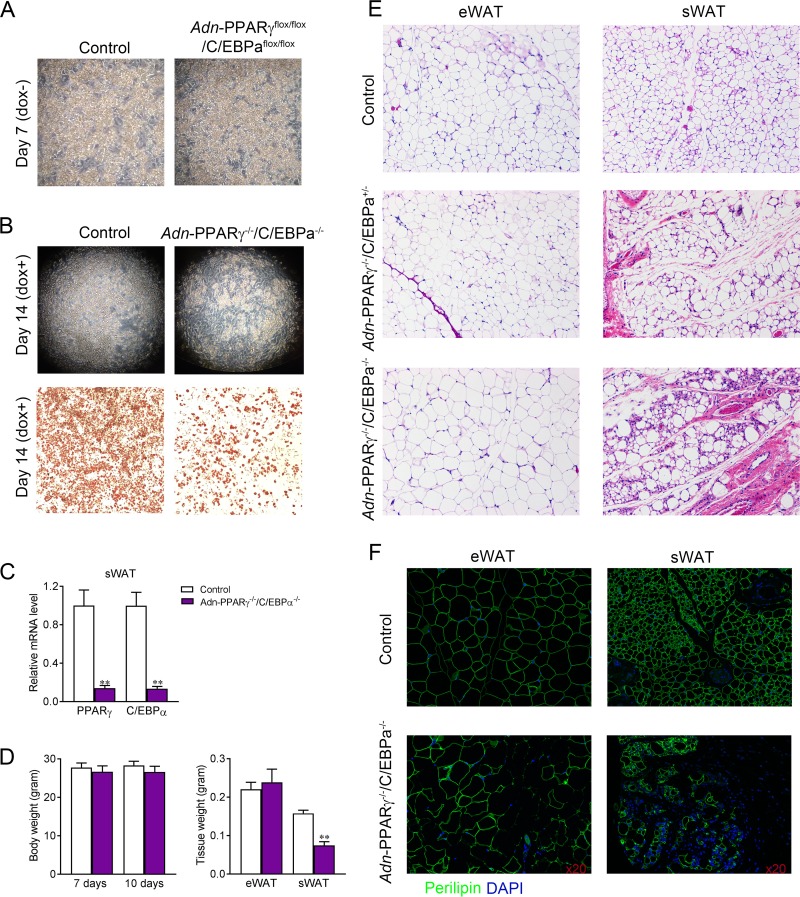
Adipose tissue is a dynamic organ that makes critical contributions to whole-body metabolic homeostasis. Although recent studies have revealed that different fat depots have distinct molecular signatures, metabolic functions and adipogenic mechanisms, peroxisome proliferator-activated receptor γ (PPARγ) is still widely viewed as the master regulator of adipogenesis and critical for maintaining mature adipocyte function. Using an inducible, adipocyte-specific knockout system, we explored the role of PPARγ in mature adipocytes in vivo Short-term PPARγ deficiency in adipocytes reduces whole-body insulin sensitivity, but adipocytes are viable both in vitro and in vivo However, after exposure to a high-fat diet, even short-term PPARγ deficiency leads to rapid adipocyte death. When mature adipocytes are depleted of both PPARγ and CCAAT-enhancer-binding protein α (C/EBPα), they are rapidly depleted of lipids and undergo adipocyte death, both in vitro and in vivo Surprisingly, although thiazolidinediones (TZDs; PPARγ agonists) are thought to act mainly on PPARγ, PPARγ in adipocytes is not required for the whole-body insulin-sensitizing effect of TZDs. This offers new mechanistic aspects of PPARγ/TZD action and its effect on whole-body metabolic homeostasis.

Keywords: C/EBPα; PPARγ; adipocyte; adipose tissue; inducible knockout; insulin sensitization; mouse model; obesity; thiazolidinedione.


Figures

FIG 1
FIG 1
Adipocytes are viable after transient inducible PPARγ deletion in vivo. (A) PPARγ is normally expressed in every cell in Adn-PPARγflox/flox mice. Upon doxycycline treatment, rtTA activates the TRE promoter to induce Cre expression. Cre protein subsequently eliminates the floxed region in the PPARγ genome (exon 1 and exon 2) and eliminate PPARγ expression in all existing mature adipocytes (Adn-PPARγ−/−). (B) Relative mRNA expression level of PPARγ in various tissues of Adn-PPARγ−/− mice and their control littermates. Three male mice were included per group; data represent the means ± SEM. (C) Relative mRNA expression level of PPARγ in macrophages, the adipocyte fraction, and SVFs of eWAT and sWAT. Three male mice were included per group; data represent the means ± SEM. *, P < 0.05 compared to control littermates. (D) Western blot analysis of PPARγ and tubulin. Three male mice were included per group. (E and F) HE staining (E) and immunofluorescence staining for perilipin (red) (F) on slides of eWAT and sWAT from Adn-PPARγ−/− mice and their control littermates.
FIG 2
FIG 2
PPARγ-deficient adipocytes are viable and have normal lipid accumulation in vitro. (A) Immunofluorescence staining for perilipin (green) and PPARγ (red) on adipocytes differentiated from the SVFs of Adn-PPARγflox/flox mice. Cells were left untreated or treated with 5 or 10 μg/ml of doxycycline (Dox). (B) Oil red O staining on adipocytes differentiated from the SVFs of Adn-PPARγflox/flox mice. Cells were treated or not with 10 μg/ml of doxycycline. (C) Relative mRNA expression level of PPARγ in on adipocytes differentiated from the SVFs of Adn-PPARγflox/flox mice. Cells were treated or not with 10 μg/ml of doxycycline (right). Three male mice were included per group; data represent the means ± SEM.
FIG 3
FIG 3
Mature adipocyte-specific inducible deletion of PPARγ alters whole-body insulin sensitivity, glucose, and lipid metabolism. (A and B) The glucose tolerance test (GTT) (A) and insulin tolerance test (ITT) (B) were performed during the 2nd week of doxycycline HFD feeding on Adn-PPARγ−/− mice and their control littermates. The bar graph presents the area under the curve for the blood glucose levels from glucose tolerance test measurements. Eight male mice were included per group. Data represent the means ± SEM. **, P < 0.01 compared to value for control littermates. (C and D) Insulin signaling in eWAT (C) and liver (D) of Adn-PPARγ−/− mice and their control littermates. Mice were treated with 1 U/kg of insulin 2 weeks post-doxycycline treatment. sWAT protein lysates were immunoblotted with phospho-Akt, total-Akt, phospho-Erk1/2, total-Erk1/2, HKII, and ACLY antibodies. (E and F) Lipoprotein profiles determined using pooled serum samples by FPLC fractionation from Adn-PPARγ−/− mice and their control littermates at the 2nd week of doxycycline-HFD feeding. Triglyceride (E) and cholesterol (F) concentrations were measured in each indicated fraction corresponding to VLDL, intermediate/low-density lipoprotein (IDL/LDL), and high-density lipoprotein (HDL), respectively. Six male mice were included per group. (G) Western blot of circulating adiponectin after 7 days of doxycycline chow diet feeding. IgG light chain was probed as a loading control. (H and I) mRNA levels of key transcription factors (left) and inflammation markers (right) were measured by qPCR after 3 days (H) or 30 days (I) of doxycycline treatment. Nine mice were included per group; data represent the means ± SEM. **, P < 0.01 compared to control littermates.
FIG 4
FIG 4
PPARγ and C/EBPα are essential for adipocyte survival. (A) Bright-field images of adipocytes differentiated from the SVFs of Adn-PPARγflox/flox C/EBPαflox/flox mice and their control littermates (7 days after the initiation of differentiation). (B) Bright-field images (upper) and Oil Red O staining (lower) on differentiated adipocytes from both groups of mice after 7 days of doxycycline treatment (5 μg/ml) (14 days after the initiation of differentiation). (C) Relative mRNA expression level of PPARγ in sWAT of Adn-PPARγ−/− C/EBPαflox/− mice and their control littermates. Four to eight male mice were included per group; data represent the means ± SEM. (D) Body weights of Adn-PPARγ−/− C/EBPαflox/− mice and their control littermates at day 7 and day 10. Four to eight male mice were included per group, data represent the means ± SEM. (E) Representative H&E staining in sWAT and eWAT of control, Adn-PPARγ−/− C/EBPαflox/−, and Adn-PPARγ−/− C/EBPα−/− mice after 10 days of doxycycline chow diet feeding. (F) Representative immunofluorescence staining for perilipin (green) and DAPI (blue) in sWAT and eWAT of control and Adn-PPARγ−/− C/EBPαflox/− mice after 10 days of doxycycline chow diet feeding. **, P < 0.01 compared to control littermates.
FIG 5
FIG 5
PPARγ in the mature adipocyte is not required for the insulin-sensitizing effect of rosiglitazone at the whole-body level. (A) Experimental design. Adn-PPARγ−/− mice and their control littermates were first fed an HFD for 11 weeks. The doxycycline-HFD diet was introduced at day 81. Ten days after doxycycline-HFD feeding, rosiglitazone was added to the doxycycline-HFD. (B) Body weights (WB) of Adn-PPARγ−/− mice (n = 11) and their control littermates (n = 10) during doxycycline-HFD feeding. (C to E) Glucose tolerance test at day 70 (C), day 81 (D), and day 98 (E). Nine mice were included per group; data represent the means ± SEM. (F and G) Lipoprotein profiles determined using pooled serum samples by FPLC fractionation from Adn-PPARγ−/− HFD group mice and their control littermates and from Adn-PPARγ−/− HFD-plus-rosiglitazone group mice and control littermates plus rosiglitazone. Triglyceride (F) and cholesterol (G) concentrations were measured in each indicated fraction corresponding to VLDL, IDL/LDL, and HDL, respectively. Nine male mice were included per group. (H to J) sWAT (H), eWAT (I), and liver (J) tissue masses of Adn-PPARγ−/− HFD-plus-rosiglitazone group mice and their control male littermates (n = 5 male mice for the control group and n = 3 male mice for the Adn-PPARγ−/− HFD Rosi group). (K) Triglyceride and cholesterol contents in the livers of Adn-PPARγ−/− HFD-plus-rosiglitazone group mice and their male control littermates (n = 5 male mice for the control group and n = 3 male mice for the Adn-PPARγ−/− HFD Rosi group). *, P < 0.05; **, P < 0.01 compared to control littermates.
FIG 6
FIG 6
Prolonged PPARγ deletion in the mature adipocyte of HFD-fed mice accelerates adipocyte death. (A) Representative H&E staining in sWAT and eWAT of both control Rosi and Adn-PPARγ−/− HFD Rosi groups after 3 weeks of doxycycline-HFD feeding. (B) Immunofluorescence staining for perilipin (red) and DAPI (blue) in sWAT and eWAT of both groups after 3 weeks of doxycycline-HFD feeding.
FIG 7
FIG 7
Screening for PPARγ-independent rosiglitazone targets in sWAT. (A) Experimental design. Adn-PPARγ−/− mice and their control littermates were first fed an HFD for around 12 weeks. The doxycycline-HFD diet was introduced at day 81. Four days after doxycycline-HFD feeding, rosiglitazone was added to the doxycycline-HFD. Three days after adding rosiglitazone, sWAT was collected for microarray analysis. (B) Representative H&E staining in sWAT and eWAT of four groups after 7 days of doxycycline-HFD feeding. (C) Quality control and cluster of microarray samples. For each group, 3 samples (pooled from 9 mice) were used for microarray analysis. (D) PPARγ-independent TZD target genes clustered and presented by heat map, based on the log base 2-transformed expression levels for these genes. P cutoff, 0.05; fold change cutoff, 1.5.

Similar articles

Cited by

References

    1. Rosen ED, Spiegelman BM. 2014. What we talk about when we talk about fat. Cell 156:20–24. doi:10.1016/j.cell.2013.12.012. - DOI - PMC - PubMed
    1. Kusminski CM, Bickel PE, Sherer PE. 2016. Targeting adipose tissue in the treatment of obesity-associated diabetes. Nat Rev Drug Discovery 15:639–660. doi:10.1038/nrd.2016.75. - DOI - PubMed
    1. Chawla A, Lazar MA. 1994. Peroxisome proliferator and retinoid signaling pathways co-regulate preadipocyte phenotype and survival. Proc Natl Acad Sci U S A 91:1786–1790. - PMC - PubMed
    1. Tononoz P, Hu E, Spiegelman BM. 1994. Stimulation of adipogenesis in fibroblasts by PPARγ2, a lipid-activated transcription factor. Cell 79:1147–1156. doi:10.1016/0092-8674(94)90006-X. - DOI - PubMed
    1. Rosen ED, Sarraf P, Troy AE, Bradwin G, Moore K, Milstone DS, Spiegelman BM, Mortensen RM. 1999. PPAR is required for the differentiation of adipose tissue in vivo and in vitro. Mol Cell 4:611–617. doi:10.1016/S1097-2765(00)80211-7. - DOI - PubMed

Publication types