. 2018 Feb 26;9(1):825.
doi: 10.1038/s41467-018-03062-w.

A dual mechanism promotes switching of the Stormorken STIM1 R304W mutant into the activated state

Affiliations

A dual mechanism promotes switching of the Stormorken STIM1 R304W mutant into the activated state

Marc Fahrner et al. Nat Commun. .

Abstract

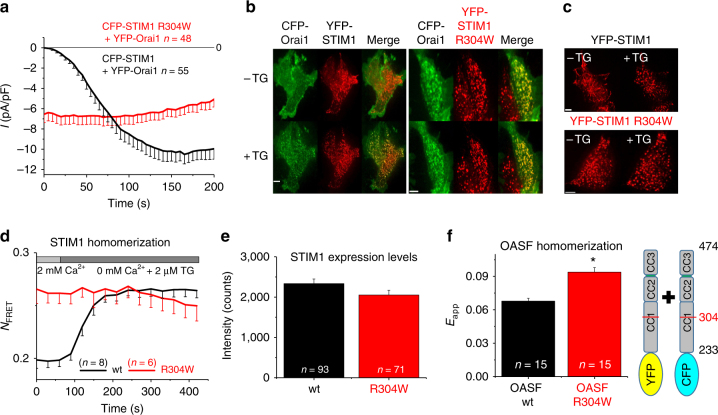
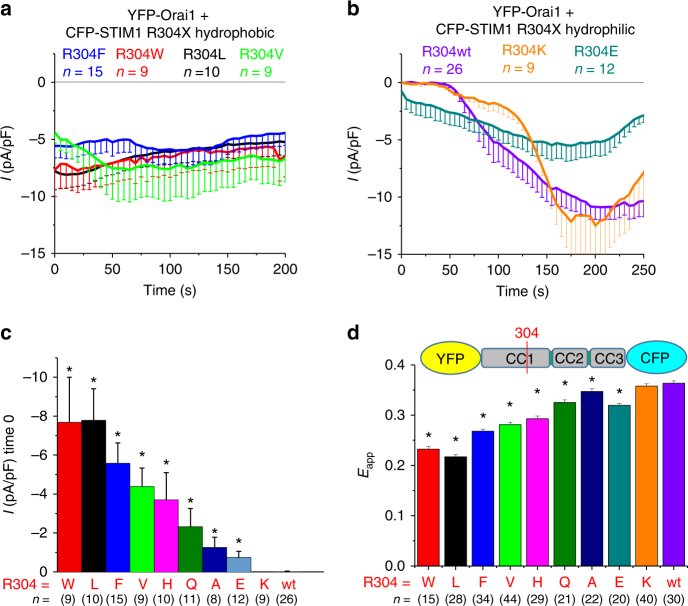
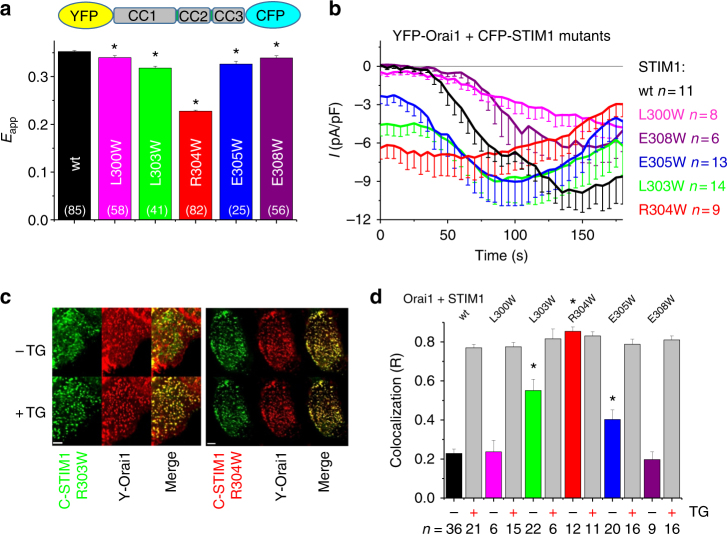
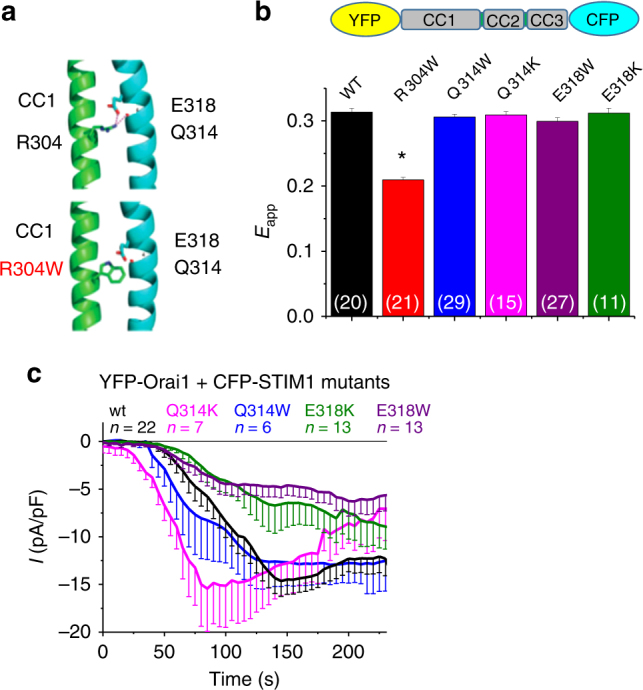
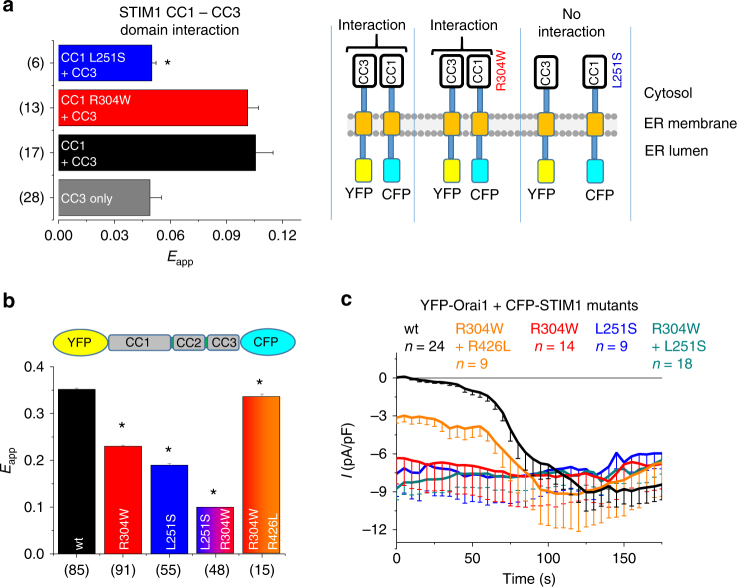
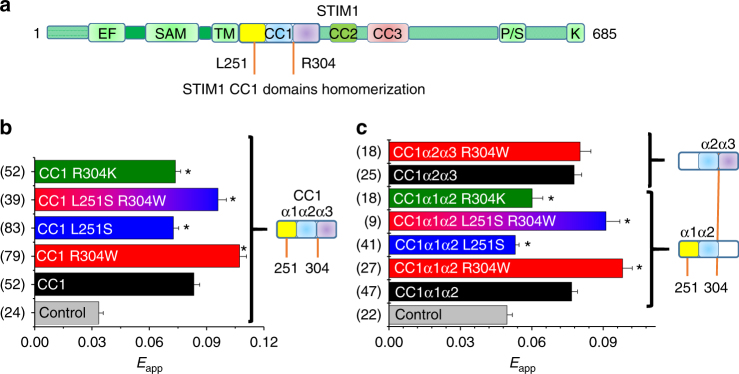
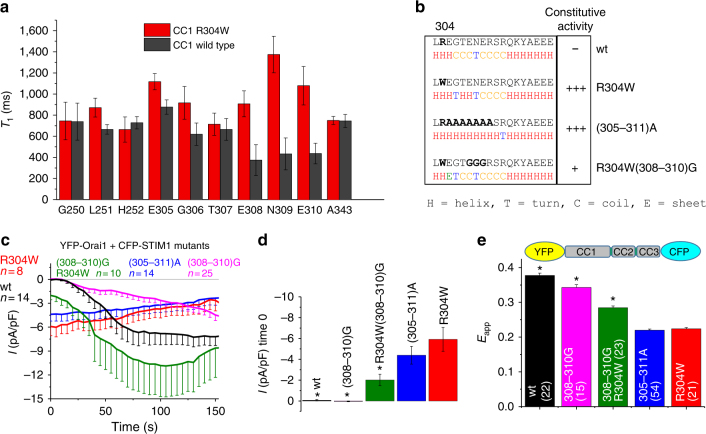
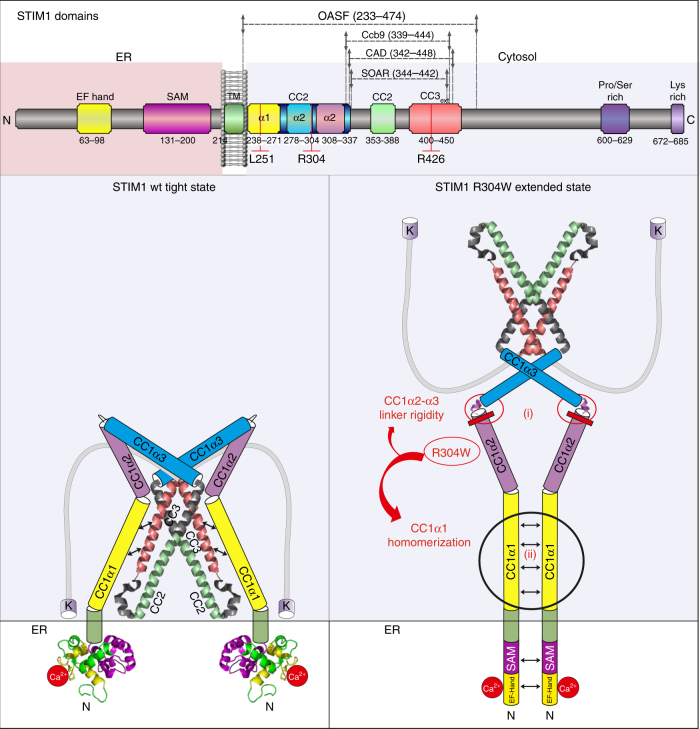
STIM1 and Orai1 are key components of the Ca2+-release activated Ca2+ (CRAC) current. Orai1, which represents the subunit forming the CRAC channel complex, is activated by the ER resident Ca2+ sensor STIM1. The genetically inherited Stormorken syndrome disease has been associated with the STIM1 single point R304W mutant. The resulting constitutive activation of Orai1 mainly involves the CRAC-activating domain CAD/SOAR of STIM1, the exposure of which is regulated by the molecular interplay between three cytosolic STIM1 coiled-coil (CC) domains. Here we present a dual mechanism by which STIM1 R304W attains the pathophysiological, constitutive activity eliciting the Stormorken syndrome. The R304W mutation induces a helical elongation within the CC1 domain, which together with an increased CC1 homomerization, destabilize the resting state of STIM1. This culminates, even in the absence of store depletion, in structural extension and CAD/SOAR exposure of STIM1 R304W leading to constitutive CRAC channel activation and Stormorken disease.


Conflict of interest statement

The authors declare no competing financial interests.

Figures

Fig. 1
Fig. 1
The Stormorken R304W STIM1 mutant is constitutively active. All experiments performed with HEK 293 cells. a Patch clamp recordings of CFP-STIM1 + YFP-Orai1 (black) and Stormorken mutant CFP-STIM1 R304W + YFP-Orai1 (red). b Representative images of co-localization experiments using confocal fluorescence imaging of CFP-Orai1 + YFP-STIM1 (left) and CFP-Orai1 + YFP-STIM1 R304W (right), both in resting (−TG) as well as store depleted (+TG) state. Length of scale bars correspond to 5 µm. c Representative images of localization experiments using confocal fluorescence imaging of YFP-STIM1 (top) and YFP-STIM1 R304W (bottom), both in resting (−TG) as well as store depleted (+TG) state. Length of scale bars correspond to 5 µm. d FRET homomerization experiments of YFP- + CFP- labeled STIM1 (black) and YFP- + CFP-labeled STIM1 R304W (red) in response to stored depletion using 2 µM TG. e Expression levels of STIM1 wt and STIM1 R304W, respectively, in HEK 293 cells. f FRET homomerization experiments of YFP-OASF + CFP-OASF (black) and YFP-OASF R304W + CFP-OASF R304W (red), respectively. *Significant difference (p < 0.05). Error bars are defined as SEM. Statistics are Student’s t‐test
Fig. 2
Fig. 2
STIM1 R304W impact of hydrophobicity. All experiments performed with HEK 293 cells. a Patch clamp recordings of YFP-Orai1 + CFP-STIM1 R304X hydrophobic mutants (R304X = F (blue), W (red), L (black), V (green)). b Patch clamp recordings of YFP-Orai1 + CFP-STIM1 R304X hydrophilic mutants (R304X = K (orange), E (cyan), wt (violet)). c Bar diagram of patch clamp recordings showing initial current densities of HEK 293 cells expressing YFP-Orai1 + CFP-STIM1 R304X (R304X = W (red), L (black), F (blue), V (green), H (magenta), Q (olive), A (marine blue), E (cyan) K (orange), wt (violet)). *Significant difference (p < 0.05) to wt. d FRET measurements of HEK 293 cells expressing conformational sensor YFP-OASF-CFP R304X mutants. The color code corresponds to c. *Significant difference (p < 0.05) to wt. Error bars are defined as SEM. Statistics are Student’s t‐test
Fig. 3
Fig. 3
High specificity of STIM1 amino acid position 304. All experiments performed with HEK 293 cells. a Bar diagram of FRET measurements of conformational sensor YFP-OASF-CFP wt (black) and mutants (L300W (magenta), L303W (green), R304W (red), E305W (blue), E308W (violet)). *Significant difference (p < 0.05) to wt. n-number in brackets. b Patch clamp recordings of YFP-Orai1 + CFP-STIM1 wt (black) and mutants (color code corresponds to a). c Representative confocal images of cells co-expressing CFP-STIM1 R303W + YFP-Orai1 (left) and CFP-STIM1 R304W + YFP-Orai1 (right) in resting (−TG) as well as store-depleted (+TG) conditions. Merge shows localization of both CFP-STIM1 and YFP-Orai1 signals in one cell. Length of scale bars correspond to 5 µm. d Bar diagram representing co-localization experiments using confocal microscopy of HEK293 cells co-expressing YFP-Orai1 and CFP-STIM1 wt and mutants, respectively, in both resting (−TG) as well as store-depleted (+TG) conditions (color code corresponds to a). *Significant difference (p < 0.05) to wt (only – TG). Error bars are defined as SEM. Statistics are Student’s t‐test
Fig. 4
Fig. 4
Constitutive activity of STIM1 R304W independent of Q314 E318. a Cartoon representing a crystallized STIM1 CC1 dimer, with highlighted interaction between R304 or R304W, respectively, with – Q314 and −E318. b Bar diagram of FRET measurements of HEK 293 cells expressing conformational sensor YFP-OASF-CFP wt (black) and mutants (R304W (red), Q314W (blue), Q314K (magenta), E318W (violet), E318K (green)). *Significant difference (p < 0.05) to wt. n-number in brackets. c Patch clamp recordings of HEK 293 cells co-expressing YFP-Orai1 + CFP-STIM1 wt (black) or mutants (color code corresponds to b). Error bars are defined as SEM. Statistics are Student’s t‐test
Fig. 5
Fig. 5
STIM1 CC1 R304W does not perturb the CC1–CC3 fragment interaction. All experiments performed with HEK 293 cells. a Bar diagram of FRET analysis (FIRE system) showing CTMG-CC3 + YTMG-CC1 wt (black) and mutants (red, R304W; blue, L251S), respectively. Control (gray) represents YTMG-CC1 co-expressed with empty CTMG. *Significant difference (p < 0.05) to (CC1 + CC3). n-number in brackets. b YFP-OASF-CFP conformational sensor FRET analysis with wt (black), R304W (red), L251S (blue), L251S + R304W (red + blue), and R304W + R426L (red + orange). *Significant difference (p < 0.05) to wt. n-number in brackets. c Patch clamp recordings of HEK cells overexpressing YFP-Orai1 + CFP-STIM1 wt (black) or mutants (R304W; L251S; double L251S + R304W; and double R304W + R426L). Error bars are defined as SEM. Statistics are Student’s t‐test
Fig. 6
Fig. 6
CC1 R304W increases CC1-CC1 homomerization. All experiments performed with HEK 293 cells. a Schematic representation of STIM1. b Bar diagram of FRET analysis (FIRE system) showing homomerization of CC1 wt or mutants (R304W, L251S, double L251S + R304W, R304K). Control (gray) represents YTMG-CC1 co-expressed with empty CTMG. *Significant difference (p < 0.05) to CC1 (black). c FRET analysis (FIRE system) of homomerization experiments of CC1α1α2 wt or mutants (R304W, L251S, double L251S + R304W, R304K) (*significant difference (p < 0.05) to CC1α1α2 (black)); CC1α2α3 wt and R304W, respectively. n-number in brackets. Error bars are defined as SEM. Statistics are Student’s t‐test
Fig. 7
Fig. 7
R304W induces formation of additional helical turn. a NMR 15N-T1 relaxation times (70 MHz) for peptide bond 15N of selected assigned residues in CC1 wt (black bars) and CC1 R304W (red bars). Error bars are defined as SD. b Bioinformatic secondary structure prediction highlighting CC1 region aa303–320. Predictions performed with sequences of wt, R304W, (305–311)A, and R304W (308–310)G, respectively. c Patch clamp recordings of HEK 293 cells co-expressing YFP-Orai1 + CFP-STIM1 wt (black) and mutants (R304W (red); R304W (308–310)G (green); (305–311)A (blue); (308–310)G (magenta)). Color-coded bar diagram of initial currents at time 0 of patch clamp recordings are represented in d. *Significant difference (p < 0.05) to R304W. e YFP-OASF-CFP conformational sensor FRET analysis with wt (black), (308–310)G (magenta), R304W (308–310)G (green); (305–311)A (blue), and R304W (red)). *Significant difference (p < 0.05) to R304W. n-number in brackets. Error bars are defined as SEM. Statistics are Student’s t‐test
Fig. 8
Fig. 8
Hypothetical conformational models of STIM1 wt and STIM1 R304W in resting cell conditions. STIM1 domains (top). STIM1 wt (left) packs into a tight conformation as a result of the intramolecular CC1–CC3 clamp interaction. STIM1 R304W (right), in contrast, assumes an extended conformation. The STIM1 R304W mutation (i) increases CC1α2 helicity and stiffens the linker region between CC1α2 and CC1α3, which together with (ii) an enforced CC1–CC1 homomerization antagonizes formation of the CC1–CC3 clamp

Similar articles

Cited by

References

    1. Berridge MJ, Bootman MD, Roderick HL. Calcium signalling: dynamics, homeostasis and remodelling. Nat. Rev. Mol. Cell. Biol. 2003;4:517–529. doi: 10.1038/nrm1155. - DOI - PubMed
    1. Zheng L, Stathopulos PB, Li GY, Ikura M. Biophysical characterization of the EF-hand and SAM domain containing Ca2+ sensory region of STIM1 and STIM2. Biochem. Biophys. Res. Commun. 2008;369:240–246. doi: 10.1016/j.bbrc.2007.12.129. - DOI - PubMed
    1. Stathopulos P. B., Li G. Y., Plevin M. J., Ames J. B., Ikura M. Stored Ca2+ depletion-induced oligomerization of stromal interaction molecule 1 (STIM1) via the EF-SAM region: an initiation mechanism for capacitive Ca2+ entry. J. Biol. Chem.281, 35855–35862 (2006). - PubMed
    1. Stathopulos PB, Zheng L, Li GY, Plevin MJ, Ikura M. Structural and mechanistic insights into STIM1-mediated initiation of store-operated calcium entry. Cell. 2008;135:110–122. doi: 10.1016/j.cell.2008.08.006. - DOI - PubMed
    1. Luik RM, Wang B, Prakriya M, Wu MM, Lewis RS. Oligomerization of STIM1 couples ER calcium depletion to CRAC channel activation. Nature. 2008;454:538–542. doi: 10.1038/nature07065. - DOI - PMC - PubMed

Publication types

MeSH terms

Supplementary concepts