. 2018 Feb 26;8(1):3594.
doi: 10.1038/s41598-018-21945-2.

Network Motifs Capable of Decoding Transcription Factor Dynamics

Affiliations

Network Motifs Capable of Decoding Transcription Factor Dynamics

Zongmao Gao et al. Sci Rep. .

Abstract

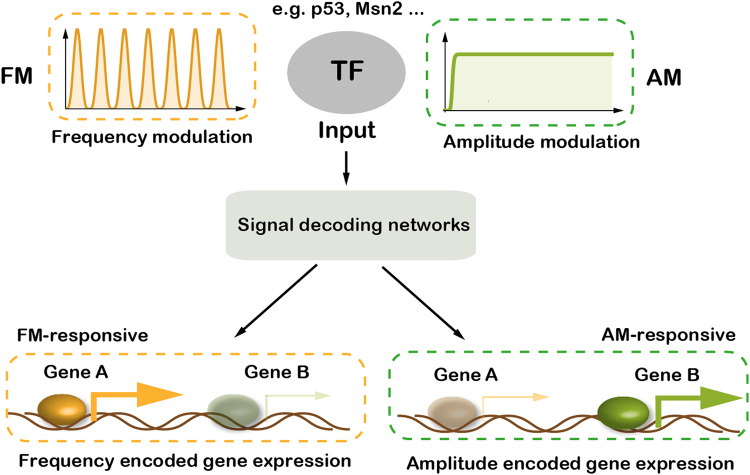
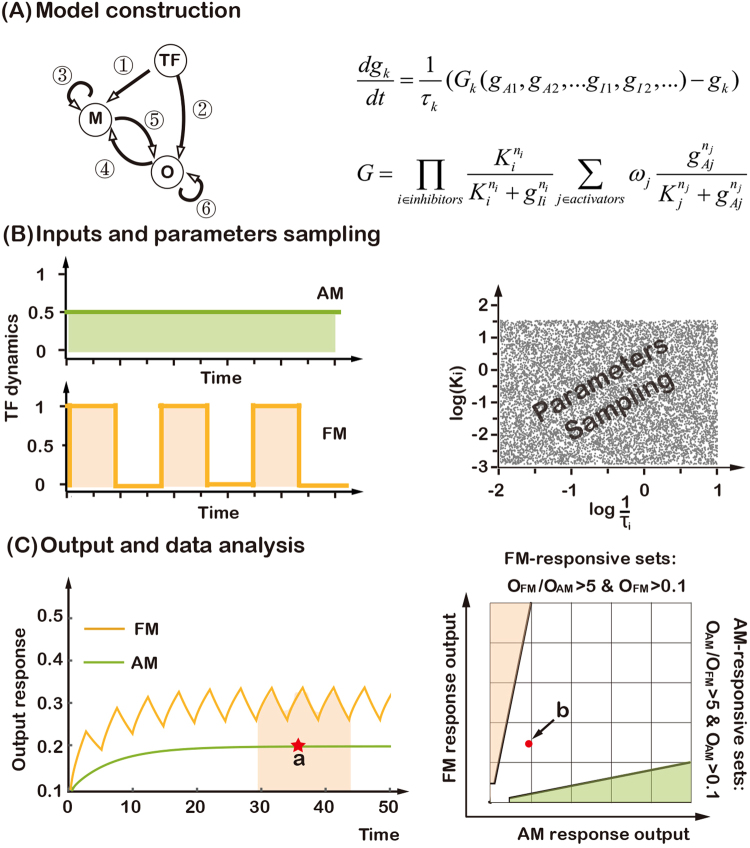
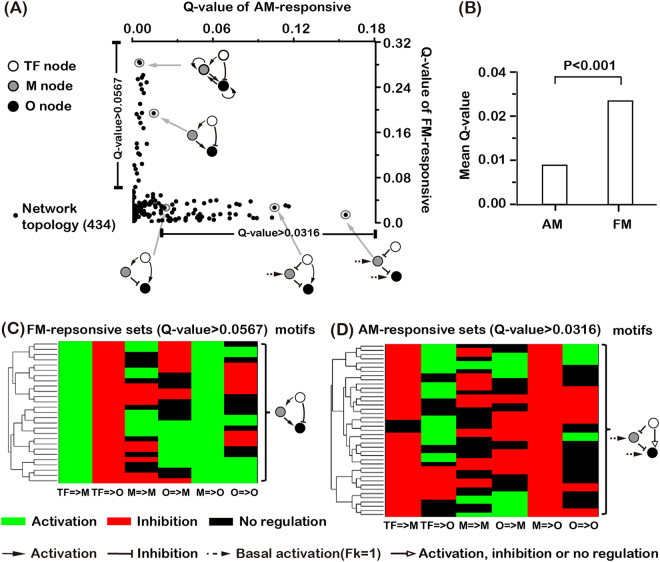
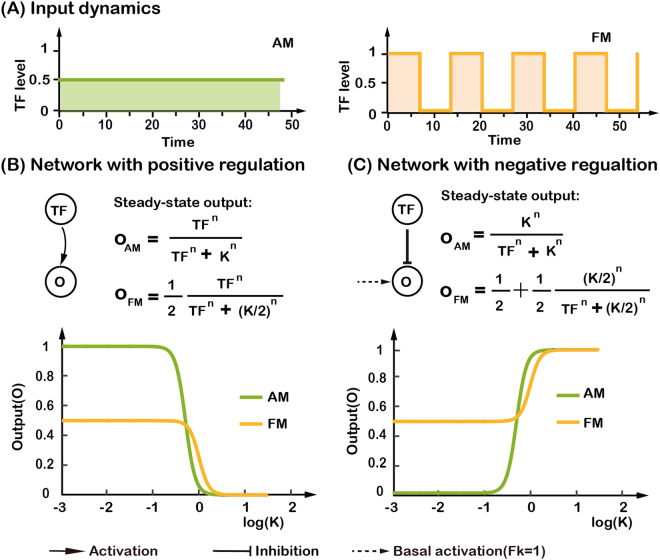
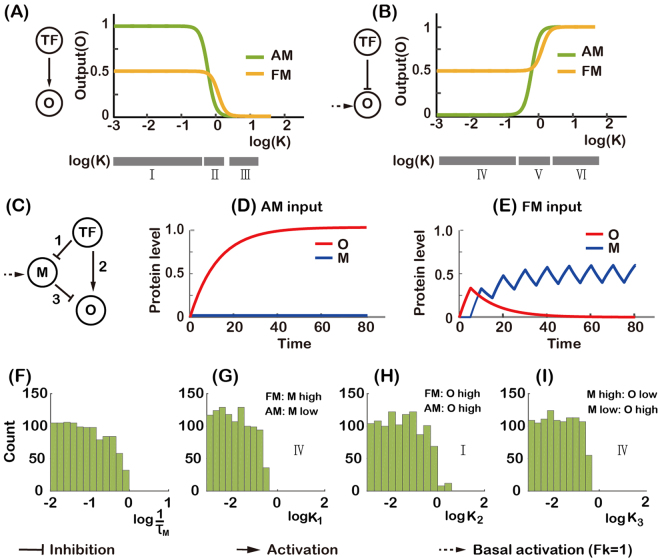
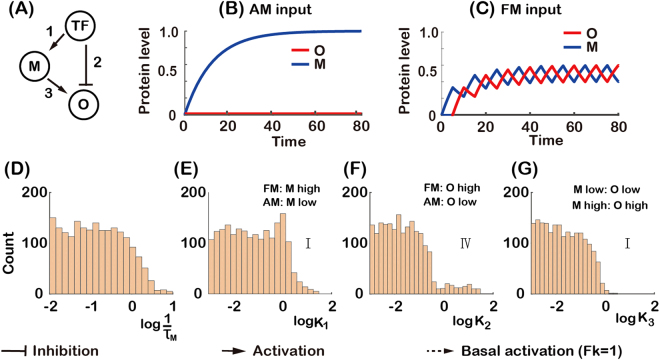
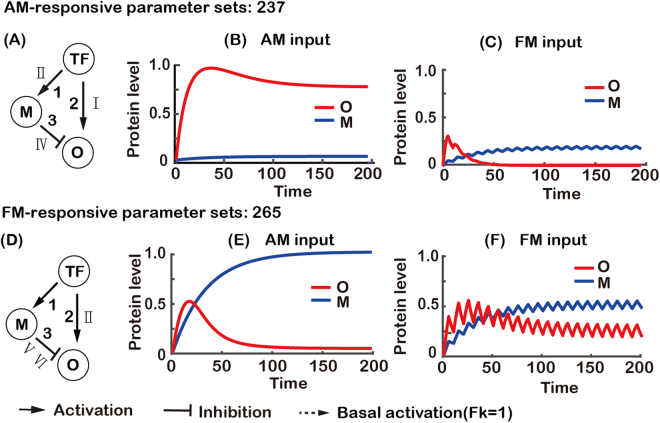
Transcription factors (TFs) can encode the information of upstream signal in terms of its temporal activation dynamics. However, it remains unclear how different types of TF dynamics are decoded by downstream signalling networks. In this work, we studied all three-node transcriptional networks for their ability to distinguish two types of TF dynamics: amplitude modulation (AM), where the TF is activated with a constant amplitude, and frequency modulation (FM), where the TF activity displays an oscillatory behavior. We found two sets of network topologies: one set can differentially respond to AM TF signal but not to FM; the other set to FM signal but not to AM. Interestingly, there is little overlap between the two sets. We identified the prevalent topological features in each set and gave a mechanistic explanation as to why they can differentially respond to only one type of TF signal. We also found that some network topologies have a weak (not robust) ability to differentially respond to both AM and FM input signals by using different values of parameters for AM and FM cases. Our results provide a novel network mechanism for decoding different TF dynamics.


Conflict of interest statement

The authors declare no competing interests.

Figures

Figure 1
Figure 1
Different types of transcription factor dynamics can induce different sets of genes. Upstream stimuli can be encoded in the dynamics of transcription factors (TFs), such as amplitude modulation (AM) and frequency modulation (FM), which can be decoded and trigger the expressions of distinct target genes. Some genes are FM-responsive, with much higher expression level under FM input than under AM input, while some genes behave inversely, and are defined as AM-responsive.
Figure 2
Figure 2
Searching for topologies that can differentially decode different transcription factor dynamics. (A) Possible direct links among three nodes (left) and the mathematical model (right). Each link can be in one of the three states: activation, inhibition, or no regulation. (B) AM and FM input dynamics of transcription factor (left) and Latin Hypercube sampling of the parameters of the model (right). (C) For AM, the steady-state output (a) is recorded. For FM, the asymptotic average output (schematically shown within the colored area) is recorded in the simulations (left). Illustration of the output analysis and the criterion for decoding AM- and FM-inputs (right), Red dot (b) represents the output from the example of the left panel.
Figure 3
Figure 3
Network’s ability and typical motifs to decode AM and FM inputs. (A) Scatter plot for the Q values of AM- and FM-responsive sets. Each point represents one of the 434 networks. Also shown are representative motifs in decoding FM and AM inputs. (B) The mean Q value of AM- and FM-responsive sets for the 434 networks. Student’s t-test was used to obtain the significance. (C) Clustering of networks with FM Q value >0.0567 (20% of the maximum FM Q value). Common structural features are extracted and shown on the right of the panel. (D) Same as in (C), for networks with AM Q value >0.0316 (20% of the maximum AM Q value).
Figure 4
Figure 4
Analysis of two-node networks for decoding AM and FM input signals. (A) Input signals with two different transcription factor dynamics, whose strengths has equal total area under the input curves. (B) Steady-state expression level of the target gene for two-node network with positive regulation. It is plotted as a function of log(K) with n = 4 for FM input (yellow) and AM input (green), respectively. (C) Same as in (B), but with negative regulation.
Figure 5
Figure 5
Analysis of AM-responsive topology. (A,B) Steady-state expression level of target gene for two-node networks (the same as in Fig. 4). The range of parameter K is subdivided into different regions as labeled. (C) An AM-responsive network with numbered links. (FI) The histograms of functional parameters. (F) Parameter τM is the half-life of the gene product of node M. (GI) Parameter Ki is the activation or repression threshold of the ith link. Roman numerals indicate the parameter regions of two-node networks in Fig. 5A and B. The distributions of the other functional parameters do not differ significantly from the uniform distribution and are not shown. The combined effect of the parameters is that the product of node M can accumulate for FM but not for AM input, and can thus repress the expression of O for FM but not for AM input (D and E). (D and E were generated with 1/τM=1/τo=0.08, K1 = K2 = K3 = 0.01 and n1 = n2 = n3 = 4).
Figure 6
Figure 6
Analysis of FM-responsive topology. (A) A FM-responsive network with numbered links. (DG) The histograms of functional parameters. (D) Parameter τM is the half-life of the gene product of node M. (EG) Parameter Ki is the activation or repression threshold of the ith link. Roman numerals indicate the parameter regions of two-node networks in Fig. 5A and B. The distributions of the other functional parameters do not differ significantly from the uniform distribution and are not shown. The combined effect of the parameters is that TF activates O indirectly through M for both AM and FM input, and TF directly represses the expression of O for AM but not for FM input (B and C). (B and C were generated with 1/τM=1/τo=0.08, K1 = K2 = K3 = 0.01 and n1 = n2 = n3 = 4).
Figure 7
Figure 7
Analysis of a topology that can respond to both AM and FM inputs. (A) Parameter analysis for responding to AM input. With the parameters Ki of the links in the appropriate regions as indicated in Fig. 5A and B. TF induces a higher expression of M for FM input than AM input, resulting in higher expression of O for AM input (B) and low expression of O for FM input (C). (B and C were generated with 1/τM=0.03, 1/τo=0.1, K1 = 1.12, K2 = K3 = 0.05 and n1 = n2 = n3 = 4). (D) Parameter analysis for responding to FM input. With the parameters Ki of the links in the appropriate regions as indicated in Fig. 5A and B. When parameter K3 (from M to O) was in the region V, parameter K1 (from TF to M) had to be in the region I. TF induces a higher expression of M with AM (E) than FM input (F), resulting in a higher expression of O for FM input (F) and a lower expression of O for AM input (E). When parameter K3 was in the region VI, which makes the inhibition to O by M essentially nonexistent, this network is reduced to a two-node network. (E and F were generated with 1/τM=0.03, 1/τo=0.1, K1 = 0.01, K2 = 0.4, K3 = 0.5 and n1 = n2 = n3 = 4).

Similar articles

Cited by

References

    1. Purvis JE, Lahav G. Encoding and decoding cellular information through signaling dynamics. Cell. 2013;152:945–956. doi: 10.1016/j.cell.2013.02.005. - DOI - PMC - PubMed
    1. Jacquet M, Renault G, Lallet S, De Mey J, Goldbeter A. Oscillatory nucleocytoplasmic shuttling of the general stress response transcriptional activators Msn2 and Msn4 in Saccharomyces cerevisiae. J. Cell Biol. 2003;161:497–505. doi: 10.1083/jcb.200303030. - DOI - PMC - PubMed
    1. Kholodenko BN, Hancock JF, Kolch W. Signalling ballet in space and time. Nat. Rev. Mol. Cell Biol. 2010;11:414–426. doi: 10.1038/nrm2901. - DOI - PMC - PubMed
    1. Yosef N, Regev A. Impulse control: Temporal dynamics in gene transcription. Cell. 2011;144:886–896. doi: 10.1016/j.cell.2011.02.015. - DOI - PMC - PubMed
    1. Warmflash A, et al. Dynamics of TGF-β signaling reveal adaptive and pulsatile behaviors reflected in the nuclear localizationof transcription factor Smad4. Proc. Natl. Acad. Sci. USA. 2012;109:E1947–56. doi: 10.1073/pnas.1207607109. - DOI - PMC - PubMed

Publication types

LinkOut - more resources