. 2018 Feb 26;9(1):843.
doi: 10.1038/s41467-018-03223-x.

The interdependence of excitation and inhibition for the control of dynamic breathing rhythms

Affiliations

The interdependence of excitation and inhibition for the control of dynamic breathing rhythms

Nathan Andrew Baertsch et al. Nat Commun. .

Abstract

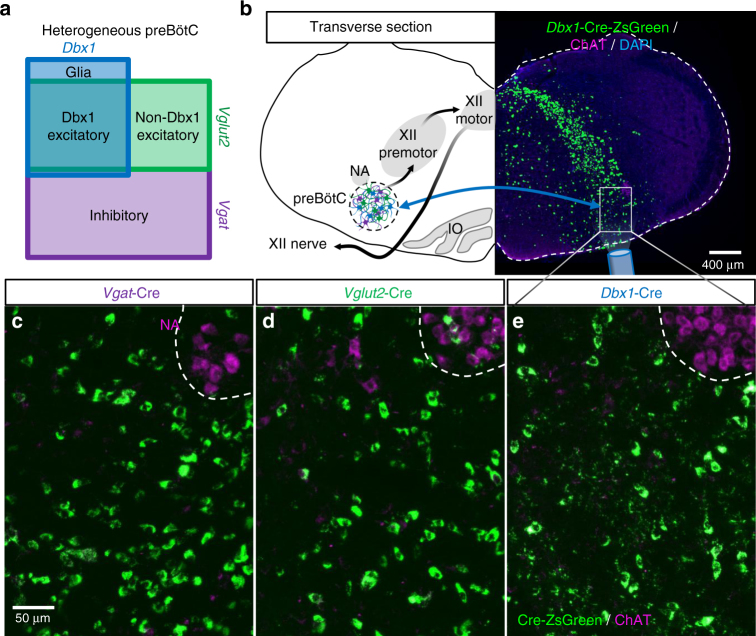
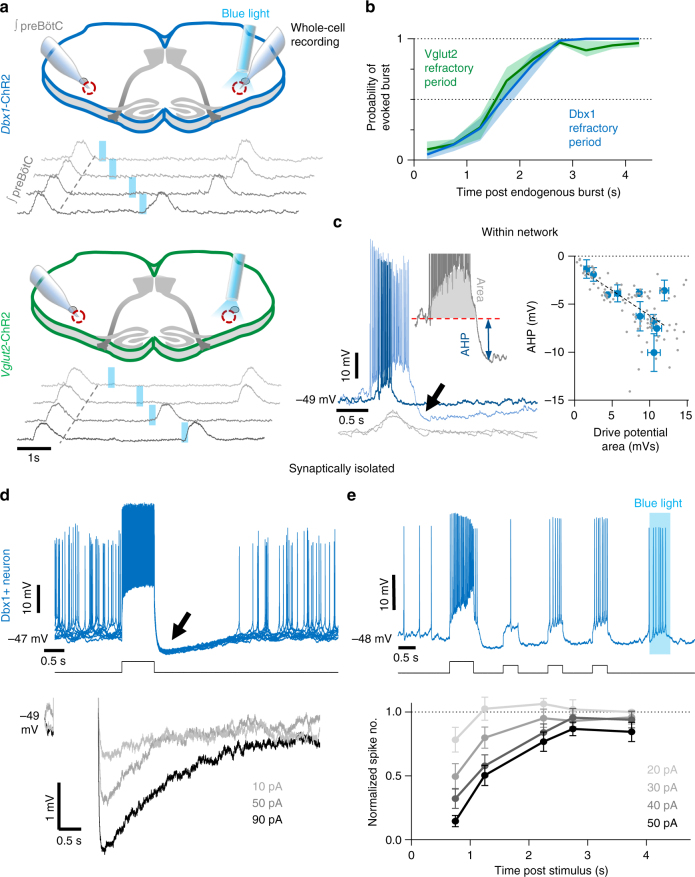
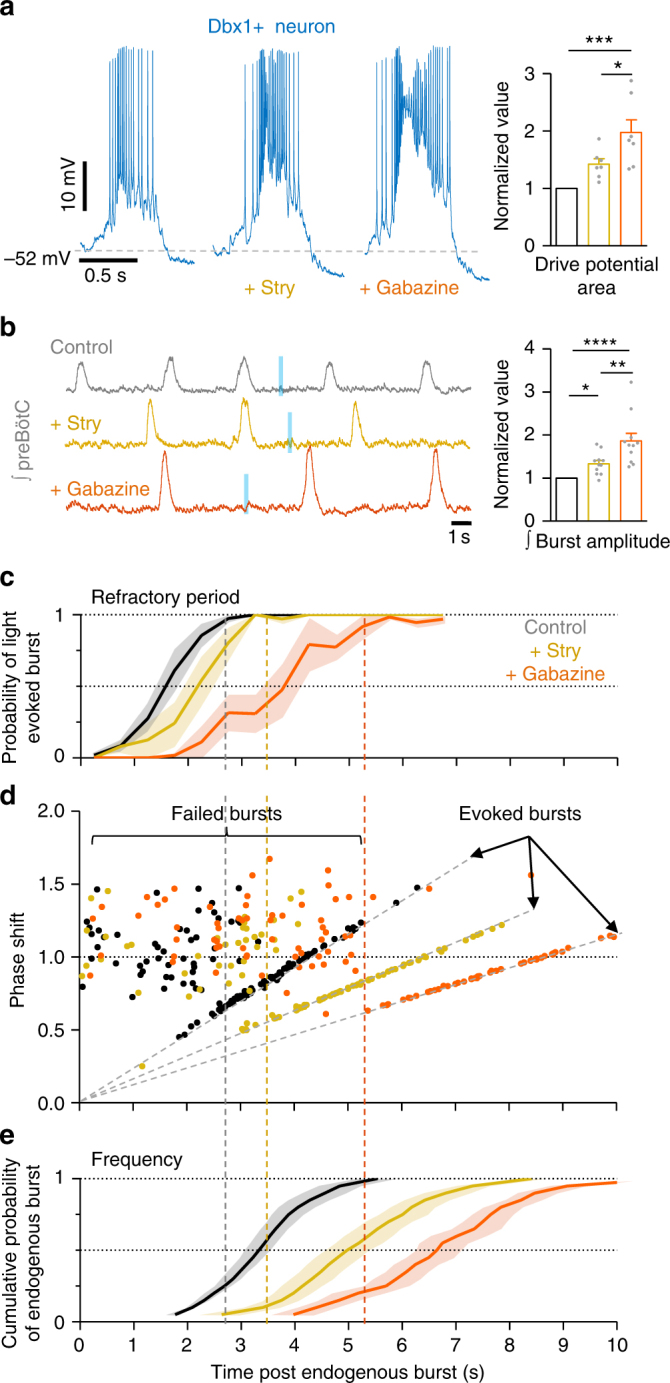
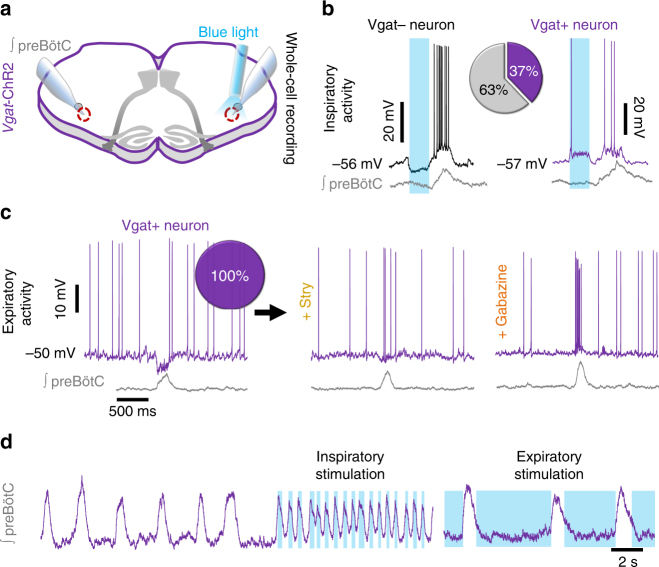
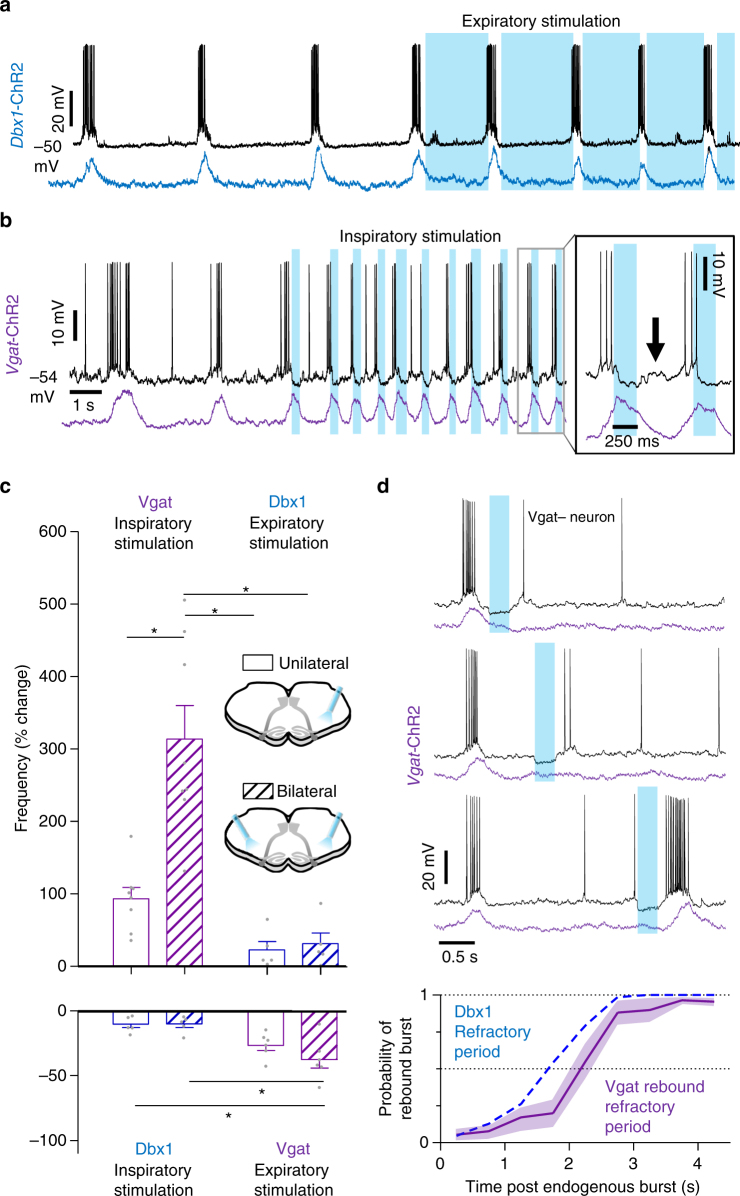
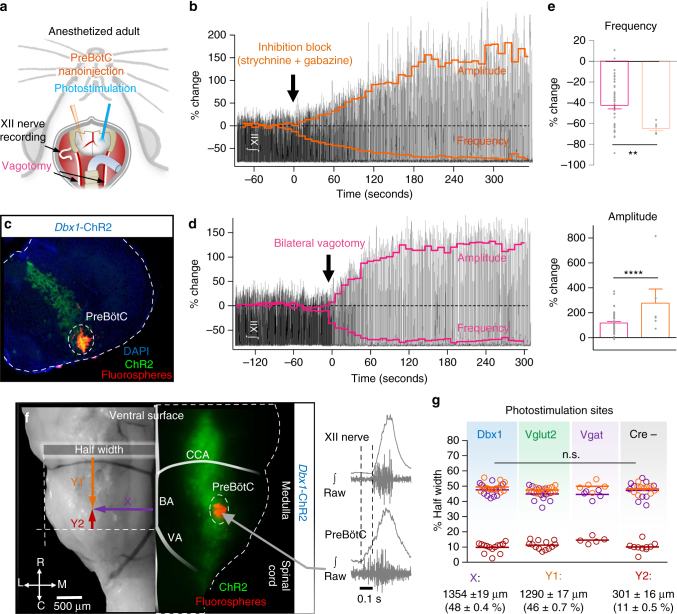
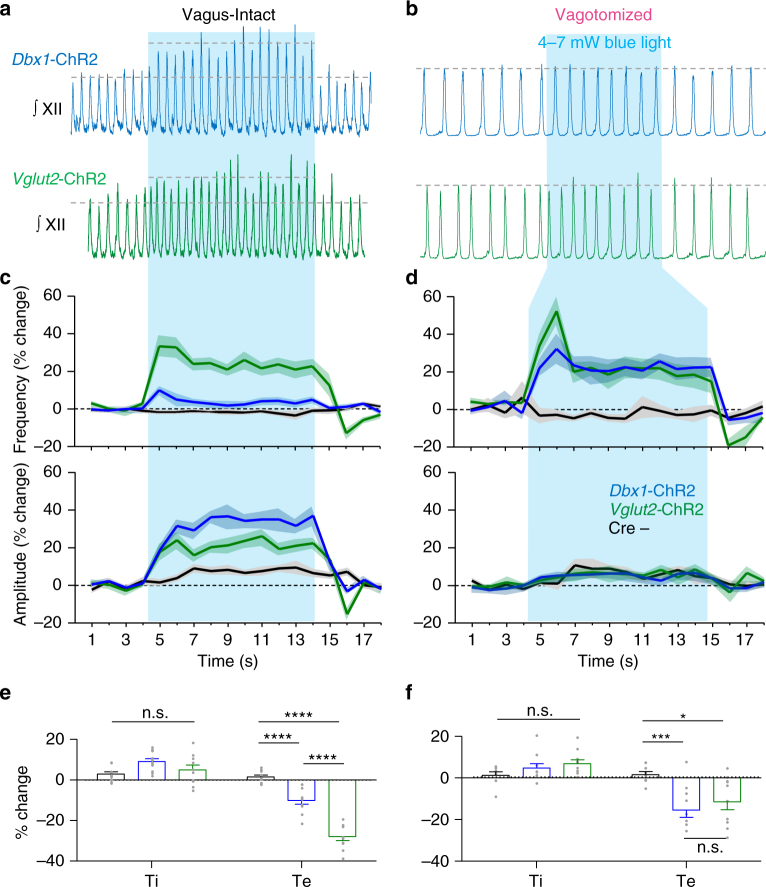
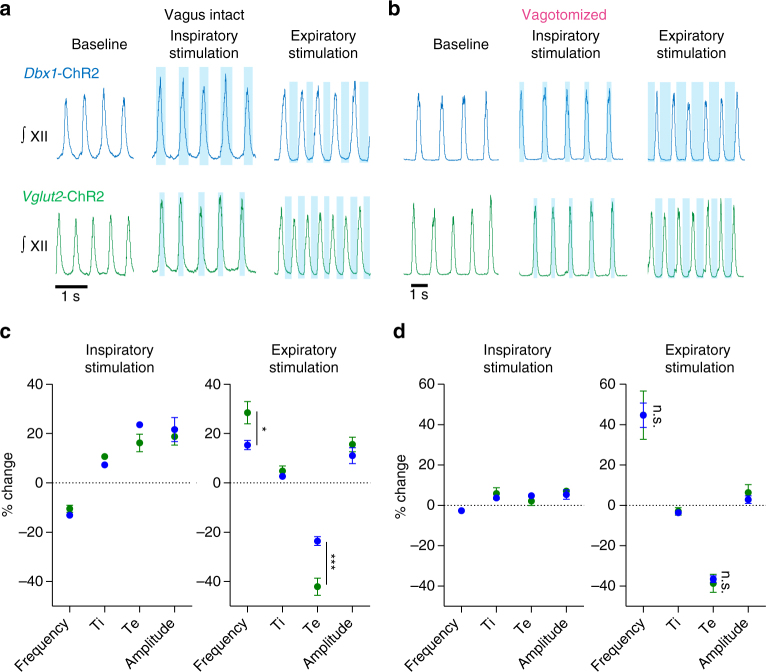
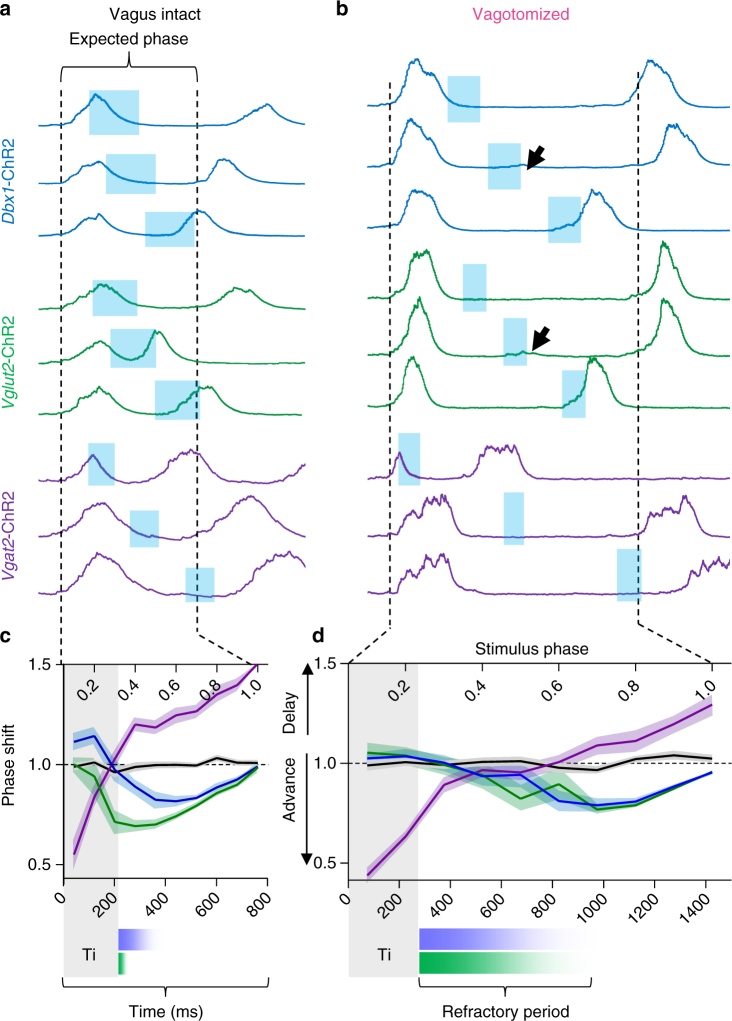
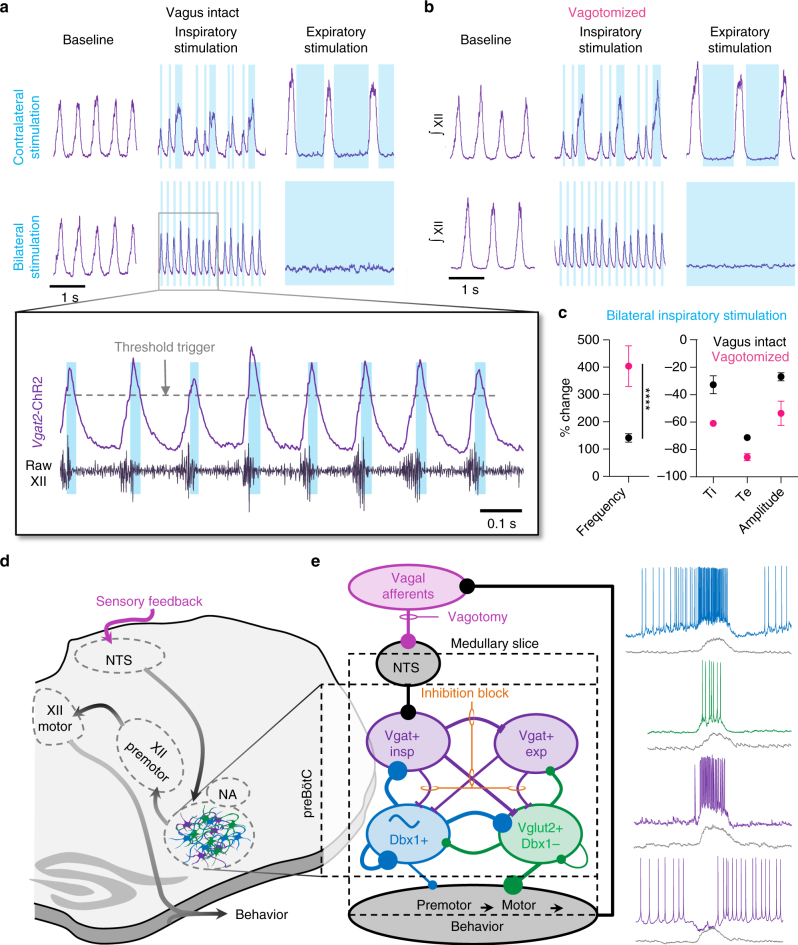
The preBötzinger Complex (preBötC), a medullary network critical for breathing, relies on excitatory interneurons to generate the inspiratory rhythm. Yet, half of preBötC neurons are inhibitory, and the role of inhibition in rhythmogenesis remains controversial. Using optogenetics and electrophysiology in vitro and in vivo, we demonstrate that the intrinsic excitability of excitatory neurons is reduced following large depolarizing inspiratory bursts. This refractory period limits the preBötC to very slow breathing frequencies. Inhibition integrated within the network is required to prevent overexcitation of preBötC neurons, thereby regulating the refractory period and allowing rapid breathing. In vivo, sensory feedback inhibition also regulates the refractory period, and in slowly breathing mice with sensory feedback removed, activity of inhibitory, but not excitatory, neurons restores breathing to physiological frequencies. We conclude that excitation and inhibition are interdependent for the breathing rhythm, because inhibition permits physiological preBötC bursting by controlling refractory properties of excitatory neurons.


Conflict of interest statement

The authors declare no competing financial interests.

Figures

Fig. 1
Fig. 1
Anatomy of the heterogeneous preBötC. a Diagram showing estimated ratios of Dbx1 and non-Dbx1 excitatory and inhibitory neurons, – with the corresponding promoters used to drive Cre expression within these preBötC subpopulations. b Schematic depicting key landmarks (NA nucleus amibiguus, IO inferior olive) and the pathway from preBötC rhythmogenesis to XII motor output and a representative 2.5× image of a transverse medullary preBötC section from an adult Dbx1-ZsGreen mouse. Blue arrows represent commissural connections between Dbx1 neurons. ce 20× z-projected images of Cre-dependent ZsGreen expression in preBötC neurons from VgatCre (c), Vglut2Cre (d), and Dbx1CreERT2 (e) mice. ChAT immunofluorescence demarks the NA dorsomedial to the preBötC
Fig. 2
Fig. 2
Intrinsic refractory properties of preBötC neurons. a Diagram of in vitro brainstem slice preparation and example of the refractory period for evoked preBötC population bursts in a Dbx1-ChR2 and Vglut2-ChR2 slice. b Quantified probability of light-evoking a preBötC burst by stimulation excitatory neurons in Dbx1-ChR2 (n = 7) and Vglut2-ChR2 (n = 7) slices. (p > 0.05 at all time points, two-way ANOVA and Bonferroni’s multiple comparisons test, means ± s.e.m. c Overlaid activity of two Dbx1+ neurons in the spontaneously active preBötC network demonstrating the relationship between burst drive potential and AHP (arrow). Quantified data from n = 10 Dbx1+ neurons shown on the right (linear regression analysis, p < 0.0001; slope = −0.52 ± 0.058). d Representative example (10 overlaid sweeps) of a synaptically isolated Dbx1+ neuron showing hyperpolarization (arrow) and reduced spiking following a 600 ms 50 pA current step (upper). Membrane potential (average of 10 sweeps) before and after graded current step intensities (bottom). e Example showing transiently reduced number of spikes evoked by small (20 pA, 400 ms) current steps during the intrinsic refractory period following a 30 pA current step in a synaptically isolated Dbx1+ neuron (note the depolarization and spiking evoked by light); average normalized number of spikes evoked at different time points following current steps of varied intensity (n = 7 neurons from n = 7 slices; means ± s.e.m.)
Fig. 3
Fig. 3
Inhibition restrains excitatory preBötC neuron activity and the refractory period. a Example Dbx1+ neuron activity under baseline conditions and following progressive blockade of glycinergic and gabaergic synaptic inhibition with strychnine (1 µM) and gabazine (1 µM), respectively. Average normalized inspiratory drive potential area (n = 7) of Dbx1+ neurons during preBötC bursts in strychnine and gabazine (*p < 0.05, ***p<0.001; means ± s.e.m.; one-way repeated measures ANOVA and Bonferroni’s multiple comparisons test). b Example of preBötC population activity from a Dbx1-ChR2 slice during inhibition block and failure to light-evoke bursts during the refractory period, and normalized burst amplitude of integrated preBötC population activity (n = 11 slices; *p < 0.05, **p<0.01, ****p<0.0001; means ± s.e.m.; Friedman test and Dunn’s multiple comparisons test). c Quantified probability of evoking a burst (0.5 s bins) relative to time post endogenous burst (s) from Dbx1-ChR2 slices during inhibition block (~100–150 trials in each condition from each slice; n = 4 slices; means ± s.e.m.). d Data from a representative Dbx1-ChR2 stimulation experiment comparing the phase shift (stimulus cycle duration/average cycle duration) elicited compared to the time of the light stimulus relative to the preceding endogenous burst. Note that in strychnine (yellow) and strychnine+gabazine (orange) failed bursts are more common for a longer duration following endogenous bursts (358 stimulations). Average data shown in Supplementary Fig 1. e Cumulative probability of a spontaneous burst (0.05 probability bins) relative to time post endogenous burst (s) from Dbx1-ChR2 slices during inhibition block (~100–150 trials in each condition from each slice; n = 4 slices; means ± s.e.m.). Vertical dashed lines correspond to the end of the refractory period and an increasing probability of spontaneous bursting
Fig. 4
Fig. 4
PreBötC inhibitory neuron populations have distinct effects on inspiratory burst frequency. a Diagram of Vgat-ChR2 brainstem slice configuration used to identify inhibitory preBötC neuron activity relative to preBötC burst phase. b Representative activity of a Vgat− inspiratory neuron showing post-inhibitory rebound following light stimulation (left) and a Vgat+ neuron with inspiratory activity (right). 14/37 (37%) recorded inspiratory neurons were inhibitory. c Example Vgat+ expiratory neuron at baseline and during blockade of synaptic inhibition with strychnine (1 µM) and gabazine (1 µM) (n = 3). Note that expiratory activity transitions to inspiratory activity following blockade of synaptic inhibition. 10/10 (100%) recorded expiratory neurons were inhibitory. d Example recording of preBötC population activity from a Vgat-ChR2 slice during phase-specific light stimulation. Average data shown in Fig. 5c
Fig. 5
Fig. 5
Phasic inhibition, but not excitation, drives high preBötC burst frequencies. a Representative inspiratory neuron and preBötC population recording during bilateral light stimulation specifically during the expiratory phase in a Dbx1-ChR2 rhythmic brainstem slice. b Representative inspiratory neuron and preBötC population activity during threshold-triggered bilateral light stimulation specifically during the inspiratory phase in a Vgat-ChR2 slice. c Average changes in frequency in Vgat-ChR2 slices during unilateral and bilateral preBötC stimulation during inspiration (n = 8) and expiration (n = 6) compared to Dbx1-ChR2 stimulation during inspiration (n = 5) and expiration (n = 5; one-way ANOVA and Bonferonni’s multiple comparisons test; *p < 0.001). d Intracellular recording of a Vgat− neuron and preBötC population activity during brief light pulses (200 ms) in a Vgat-ChR2 slice. Note that rebound spiking is reduced during the refractory period. Quantified probability of evoking a population burst via postinhibitory rebound relative to the time of light stimulation following an endogenous burst (0.5 s bins; n = 7 slices, ~100–150 trials/slice; mean ± s.e.m.) compared to the probability of evoked bursts during Dbx1 stimulation (data shown in Fig. 2b), demonstrating similar refractory periods
Fig. 6
Fig. 6
Effects of preBötC sensory feedback inhibition on hypoglossal motor output in vivo. a Schematic of the surgical approach to access the ventral brainstem for bilateral preBötC nanoinjections, photostimulation, and vagotomy. b Representative trace of integrated hypoglossal (XII) nerve activity during bilateral injection of strychnine and gabazine (150 nl, 250 µM each) with frequency and amplitude overlaid (10 s bins). c Example transverse hemisection showing injection site marked by flourospheres localized to the preBötC in a Dbx1-ChR2 mouse. d Representative trace of XII activity during bilateral vagotomy with frequency and amplitude overlaid (10 s bins). e Quantified changes in frequency and amplitude ~5 min following vagotomy (n = 47) and blockade of preBötC fast synaptic inhibition (n = 6; unpaired two-tailed t-tests with Welch’s correction; **p < 0.01, ****p < 0.0001). f Bright field image (left) and Dbx1-ChR2 fluorescence (middle) of the ventral medulla showing the location of preBötC photostimulation relative to the basilar artery (BA), caudal cerebellar artery (CCA), and intersection of the vertebral arteries (VA). Example extracellular recording demonstrating pre-inspiratory activity relative to XII nerve activity at photostimulation sites (right). g Quantified coordinates of injected fluorospheres (bottom) demonstrate that photostimulation sites were consistent across experimental groups (Dbx1, n = 14; Vglut2, n = 14; Vgat, n = 5; Cre-, n = 10; two-way ANOVA and Bonferonni’s post hoc test; n.s., not significant, p > 0.05)
Fig. 7
Fig. 7
Excitatory preBötC neurons have a limited ability to generate rapid breathing in vivo. a, b Representative hypoglossal (XII) nerve activity during a continuous 10 s stimulation of the preBötC in Dbx1-ChR2, Vglut2-ChR2, and Cre- control mice with the vagus intact (a) and following vagotomy (b). c, d Average XII nerve burst frequency and amplitude (1 s bins) during continuous light stimulation with the vagus intact (c) (Dbx1, n = 11; Vglut2, n = 10; Cre−, n = 10) and following vagotomy (d) (Dbx1, n = 10; Vglut2, n = 10; Cre−, n = 8; means ± s.e.m.). e, f Average changes in inspiratory and expiratory time (Ti and Te, respectively) during continuous stimulation in vagus-intact (e) and vagotomized (f) mice demonstrating that changes in breathing frequency are primarily the result of reduced Te (mean ± s.e.m.; two-way ANOVA and Bonferonni’s multiple comparisons test; **p < 0.01, ***p < 0.001, ****p < 0.0001)
Fig. 8
Fig. 8
Differential frequency control of overlapping excitatory preBötC populations is specific to expiratory stimulation in vagus-intact, but not in vagotomized, mice. a, b Representative XII nerve activity during respiratory phase-specific inspiratory or expiratory preBötC stimulation in Dbx1-ChR2 and Vglut2-ChR2 mice with the vagus intact (a) and following vagotomy (b). c, d Average changes in frequency, Ti, Te, and XII burst amplitude during inspiratory and expiratory stimulation in vagus-intact (c) (Dbx1, n = 5; Vglut2, n = 6) and vagotomized (d) (Dbx1, n = 4; Vglut2, n = 4) mice (mean ± s.e.m.; two-way ANOVA and Bonferonni’s multiple comparisons test; *p < 0.05, ***p < 0.001). Note that Vglut2 stimulation only elicits a larger frequency effect than Dbx1 stimulation when sensory feedback inhibition is intact (vagus intact) and when stimulation is specific to the expiratory phase
Fig. 9
Fig. 9
Vagal sensory feedback limits the refractory period for excitatory preBötC populations. a, b Example integrated XII nerve activity during brief (100–200 ms) light stimulation at different time points within the respiratory cycle in vagus-intact (a) and vagotomized (b) Dbx1-ChR2, Vglut2-ChR2, and Vgat-ChR2 mice. Note the difference in the refractory period for partially overlapping Vglut and Dbx1 populations in vagus-intact mice. Arrows indicate failed bursts near the end of the refractory period. Traces are scaled to the expected duration of the respiratory cycle (expected phase). c, d Quantified phase shift elicited during stimulations across the respiratory cycle (stimulus phase 0 = beginning of inspiration) in vagus-intact (c) (Dbx1, n = 10; Vglut2, n = 10; Vgat, n = 5; Cre−, n = 9) and vagotomized mice (d) (Dbx1, n = 9; Vglut2, n = 7; Vgat, n = 3; Cre−, n = 9; mean ± s.e.m.). Data from Cre− control mice shown in black. Refractory periods for Dbx1-ChR2 (blue) and Vglut2-ChR2 (green) shown on equivalent time scales relative to the average respiratory cycle duration in vagus-intact and vagotomized conditions. Note the exaggerated refractory period in vagotomized mice and the minimal effect of Vgat-ChR2 stimulation during the refractory period
Fig. 10
Fig. 10
Rapid breathing is elicited by phasic inhibition during inspiration. a, b Example XII activity at baseline and during unilateral or bilateral light stimulation during the inspiratory or expiratory phase in vagus-intact (a) and vagotomized (b) Vgat-ChR2 mice. Expanded view demonstrates precise timing of light pulses triggered by the onset of inspiration. Note the irregular rhythm elicited by contralateral stimulation. c Quantified changes in frequency, Ti, Te, and XII amplitude during bilateral inspiratory light stimulation in vagus-intact (n = 5; black) and vagotomized (n = 3; pink) mice (mean ± s.e.m.; two-way ANOVA and Bonferonni’s multiple comparisons test; ****p < 0.0001). d, e Model of interactions between excitatory and inhibitory preBötC populations controlling breathing frequency. Representation of the heterogeneous organization of the preBötC and simplified pathway from sensory input to rhythmogenesis to behavioral output (d). Hypothesized interactions between preBötC subpopulations (e). Line weight indicates the relative strength of connections. Interactions determine the activity pattern of each neuron type (right)

References

    1. Basar E, Duzgun A. Links of consciousness, perception, and memory by means of delta oscillations of brain. Front. Psychol. 2016;7:275. doi: 10.3389/fpsyg.2016.00275. - DOI - PMC - PubMed
    1. Coulon P, Landisman CE. The potential role of gap junctional plasticity in the regulation of state. Neuron. 2017;93:1275–1295. doi: 10.1016/j.neuron.2017.02.041. - DOI - PubMed
    1. Fries P. Rhythms for cognition: communication through coherence. Neuron. 2015;88:220–235. doi: 10.1016/j.neuron.2015.09.034. - DOI - PMC - PubMed
    1. Hanslmayr S, Staresina BP, Bowman H. Oscillations and episodic memory: addressing the synchronization/desynchronization conundrum. Trends Neurosci. 2016;39:16–25. doi: 10.1016/j.tins.2015.11.004. - DOI - PMC - PubMed
    1. Yokosawa K, Kimura K, Chitose R, Momiki T, Kuriki S. Alpha-band rhythm suppression during memory recall reflecting memory performance. Conf. Proc. IEEE Eng. Med. Biol. Soc. 2016;2016:4539–4542. - PubMed

Publication types

MeSH terms