. 2019 Jul;24(7):1053-1064.
doi: 10.1038/s41380-018-0023-7. Epub 2018 Feb 26.

Synaptic and transcriptionally downregulated genes are associated with cortical thickness differences in autism

Affiliations

Synaptic and transcriptionally downregulated genes are associated with cortical thickness differences in autism

Rafael Romero-Garcia et al. Mol Psychiatry. 2019 Jul.

Abstract

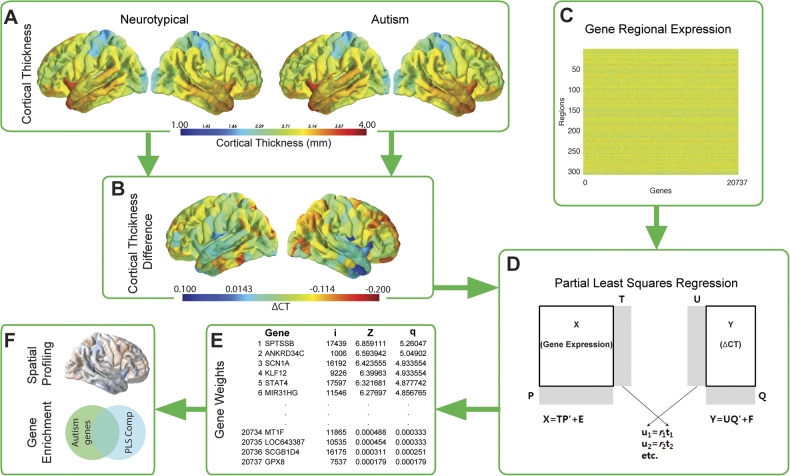
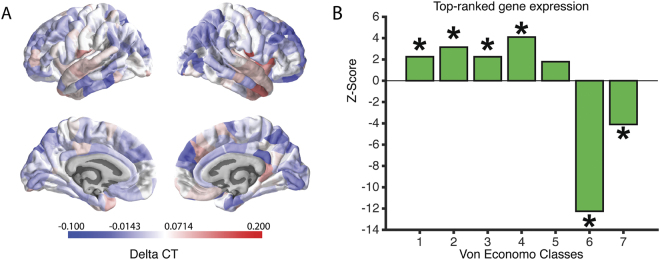
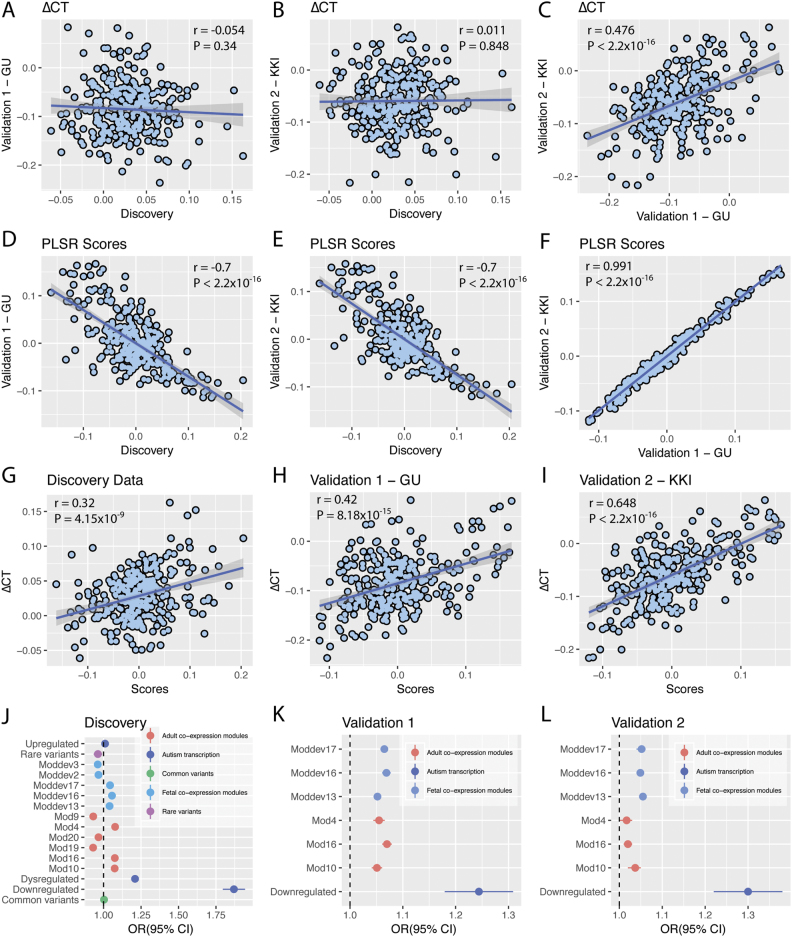
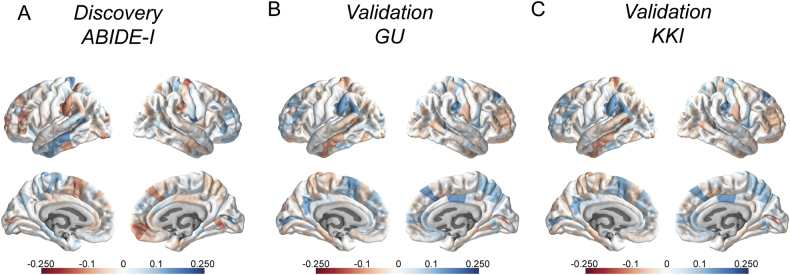
Differences in cortical morphology-in particular, cortical volume, thickness and surface area-have been reported in individuals with autism. However, it is unclear what aspects of genetic and transcriptomic variation are associated with these differences. Here we investigate the genetic correlates of global cortical thickness differences (ΔCT) in children with autism. We used Partial Least Squares Regression (PLSR) on structural MRI data from 548 children (166 with autism, 295 neurotypical children and 87 children with ADHD) and cortical gene expression data from the Allen Institute for Brain Science to identify genetic correlates of ΔCT in autism. We identify that these genes are enriched for synaptic transmission pathways and explain significant variation in ΔCT. These genes are also significantly enriched for genes dysregulated in the autism post-mortem cortex (Odd Ratio (OR) = 1.11, Pcorrected 10-14), driven entirely by downregulated genes (OR = 1.87, Pcorrected 10-15). We validated the enrichment for downregulated genes in two independent data sets: Validation 1 (OR = 1.44, Pcorrected = 0.004) and Validation 2 (OR = 1.30; Pcorrected = 0.001). We conclude that transcriptionally downregulated genes implicated in autism are robustly associated with global changes in cortical thickness variability in children with autism.


Conflict of interest statement

ETB is employed half-time by GSK and holds stock in GSK. The remaining authors declare that they have no conflict of interest.

Figures

Fig. 1
Fig. 1
Schematic overview of the methodology used to identify gene contribution. Mean cortical thickness was extracted for both the autism and the neurotypical groups across 308 cortical nodes (a). A difference score in cortical thickness (ΔCT; autism—neurotypical) was calculated between these two groups (b). In parallel the median AIBS gene expression profiles for 20,737 genes were calculated across the same 308 cortical nodes used in the imaging analysis (c). Both these streams were included in a bootstrapped PLSR analysis that used the gene expression profiles as predictors and the ΔCT as response variable (d). The PLSR assigns weights to each gene in terms of its contribution to the overall model in each component. Bootstrapped standard errors were derived and the gene weights were Z-transformed and corrected for multiple comparison using a FDR inverse quantile transform correction to account for winners curse (e; i = gene index number, z = z-score for that gene’s association and q = FDR corrected z-score). Genes that were significant after FDR correction (z-score >1.96) were analysed in terms of their spatial expression as well as tested for enrichment against three classes of risk for autism: dysregulated autism genes in the postmortem cortex, genes harbouring rare de novo variants and common genetic variants in autism (f)
Fig. 2
Fig. 2
Expression and Von Economo classification for PLSR1. The heatmap in a shows the ΔCT distribution across all 308 cortical regions. The barplot in b shows the z-scores of the mean distribution across the different Von Economo Classes (Class 1: granular cortex, primary motor cortex. Class 2: association cortex. Class 3: association cortex. Class 4: dysgranular cortex, secondary sensory cortex. Class 5: agranular cortex, primary sensory cortex. Class 6: limbic regions, allocortex. Class 7: insular cortex.). All significant over- or under-expression classes are marked with an asterisk. To determine significance, we used permutation testing and an false discovery rate corrected p-value < 0.025 to fully account for two-tailed testing
Fig. 3
Fig. 3
Gene enrichment and dataset comparisons. ac Show the correlation between ∆CT in the three datasets. df Show the correlation between the PLSR scores of all three datasets. gi Show the correlation between ∆CT and the PLSR scores in all three datasets (indicating that increased scores are strongly correlated with increased ∆CT). j Shows the odds ratios for the gene-enrichment analysis in the discovery dataset. All significantly enriched modules were replicated in the validation datasets (k and l) apart from module 4 of the adult co-expression modules. Pearson correlation coefficient and P-values of the correlations are provided in the top of the respective panels
Fig. 4
Fig. 4
PLSR1 scores for all autism datasets. ac represent the PLSR1 scores for the three autism datasets across 308 cortical regions. a Represents the discovery dataset, b represents Validation 1 and c represents Validation 2

References

    1. American Psychiatric Association. Diagnostic and statistical manual of mental disorders. 5th ed. Arlington, VA: American Psychiatric Press; 2013. .
    1. Lai MC, Lombardo MV, Suckling J, Ruigrok ANV, Chakrabarti B, Ecker C, et al. Biological sex affects the neurobiology of autism. Brain. 2013;136:2799–815. doi: 10.1093/brain/awt216. - DOI - PMC - PubMed
    1. Ecker C. The neuroanatomy of autism spectrum disorder: an overview of structural neuroimaging findings and their translatability to the clinical setting. Autism. 2016;21:18–28. doi: 10.1177/1362361315627136. - DOI - PubMed
    1. Mensen VT, Wierenga LM, van Dijk S, Rijks Y, Oranje B, Mandl RCWW, et al. Development of cortical thickness and surface area in autism spectrum disorder. NeuroImage Clin. 2016;13:215–22. doi: 10.1016/j.nicl.2016.12.003. - DOI - PMC - PubMed
    1. Ecker C, Ginestet CE, Feng Y, Johnston P, Lombardo MV, Lai MC, et al. Brain surface anatomy in adults with autism. JAMA Psychiatry. 2013;70:59. doi: 10.1001/jamapsychiatry.2013.265. - DOI - PubMed

Publication types

LinkOut - more resources