. 2018 Apr;14(4):352-360.
doi: 10.1038/s41589-018-0004-9. Epub 2018 Feb 26.

A robotic multidimensional directed evolution approach applied to fluorescent voltage reporters

Affiliations

A robotic multidimensional directed evolution approach applied to fluorescent voltage reporters

Kiryl D Piatkevich et al. Nat Chem Biol. 2018 Apr.

Erratum in

Abstract

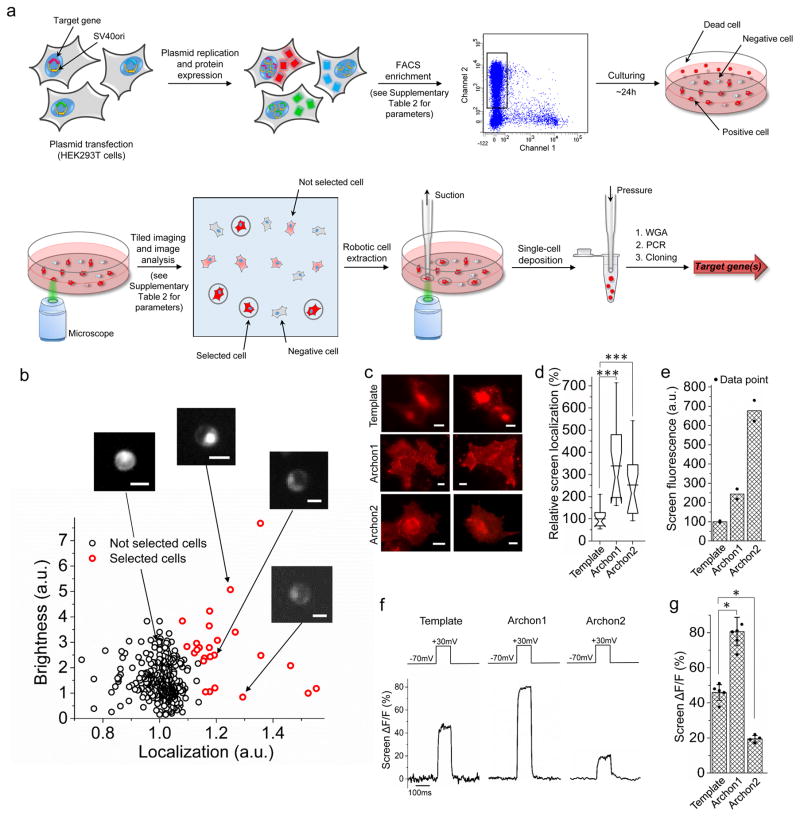
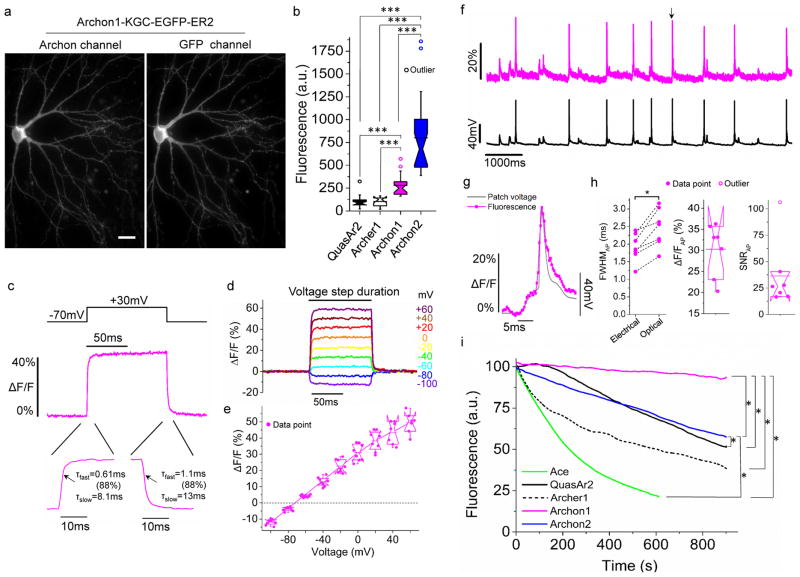
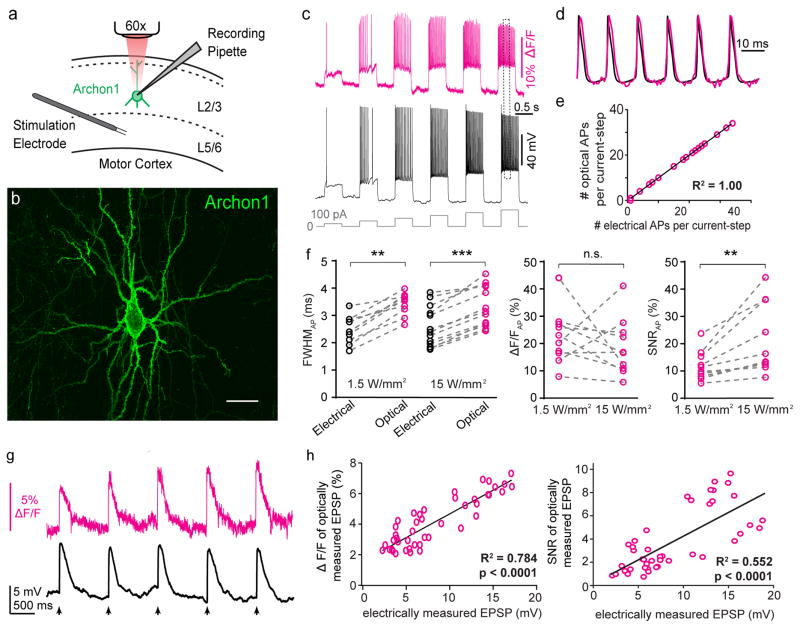
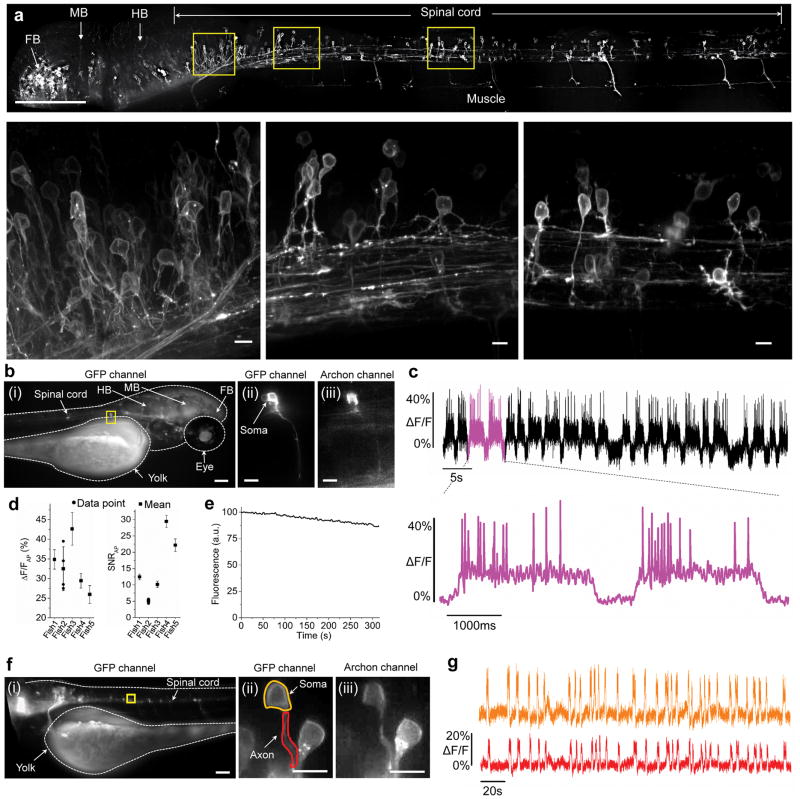
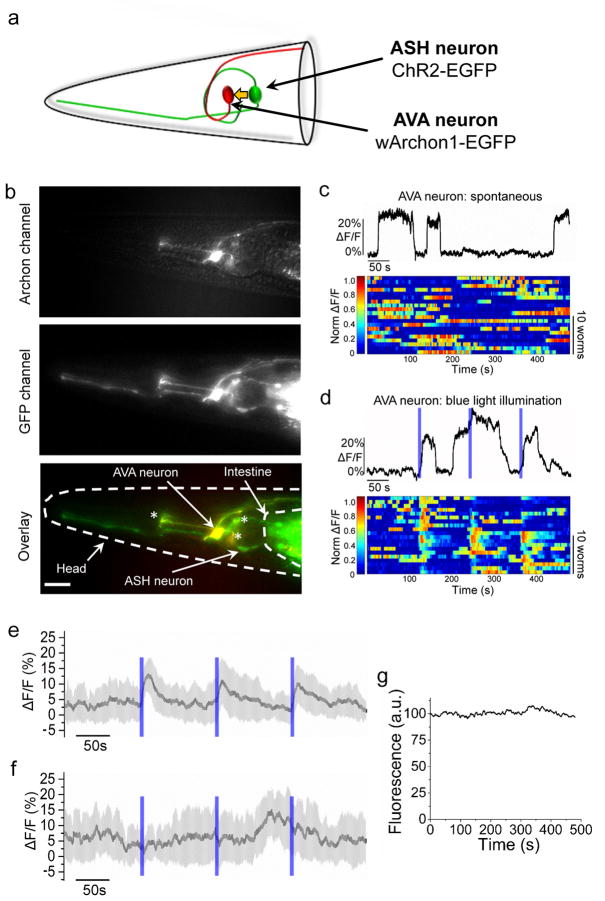
We developed a new way to engineer complex proteins toward multidimensional specifications using a simple, yet scalable, directed evolution strategy. By robotically picking mammalian cells that were identified, under a microscope, as expressing proteins that simultaneously exhibit several specific properties, we can screen hundreds of thousands of proteins in a library in just a few hours, evaluating each along multiple performance axes. To demonstrate the power of this approach, we created a genetically encoded fluorescent voltage indicator, simultaneously optimizing its brightness and membrane localization using our microscopy-guided cell-picking strategy. We produced the high-performance opsin-based fluorescent voltage reporter Archon1 and demonstrated its utility by imaging spiking and millivolt-scale subthreshold and synaptic activity in acute mouse brain slices and in larval zebrafish in vivo. We also measured postsynaptic responses downstream of optogenetically controlled neurons in C. elegans.


Conflict of interest statement

COMPETING FINANCIAL INTERESTS

B.S. is a founder of the CellSorter startup company. K.D.P., E.E.J., and E.S.B. are inventors on patent applications regarding the molecules here reported. B.S., K.D.P., E.E.J., and E.S.B. are inventors on a patent application regarding the screening method here developed.

Figures

Figure 1
Figure 1. Multi-parameter directed evolution of proteins in mammalian cells via robotic cell picking
(a) Pipeline for multi-parameter directed evolution of proteins in mammalian cells using robotic cell picking. Abbreviations: FACS, fluorescence-activating cell sorting (FACS); WGA, whole-genome amplification. (b) Example data and analyses reflecting the quantitative metrics used in the cell-picker step during the second round of directed evolution, for simultaneous optimization of brightness and localization. Scale bar: 10 μm. (c) Representative fluorescence images of HEK293T cells expressing the template, Archon1 and Archon2 (n = 15, 16, and 16 cells for Archon1, Archon2, and the template respectively). Dynamic ranges for the images were normalized to facilitate visual comparison. Scale bars, 5μm. Imaging conditions: 62 mW/mm2, λex = 628/31BP (bandpass, used throughout) from an LED, λem= 664LP (longpass, used throughout) used in (c,d). (d) Relative membrane localization of the indicators of c in HEK293T cells (n = 15, 16, and 16 cells for Archon1, Archon2, and the template respectively, each from 2 independent transfections; ***P < 0.0001 for Archon1 and ***P = 0.0003 for Archon2, Kruskal-Wallis analysis of variance followed by post-hoc test via Steel’s test with the template as control group). Box plots with notches are used throughout this paper, when n > 6, as recommended by ref (narrow part of notch, median; top and bottom of the notch, 95% confidence interval for the median; top and bottom horizontal lines, 25% and 75% percentiles for the data; whiskers extend 1.5 times the interquartile range from the 25th and 75th percentiles; horizontal line, mean). (e) FACS mean fluorescence intensity for sets of live HEK293T cells expressing these indicators (n = 2 transfected samples, each; individual data points in black dots). (f) Representative fluorescence changes for these indicators with a 100 mV voltage step, measured in HEK293T cells. Imaging conditions: λex = 637nm laser light, λem= 664LP, 800 mW/mm2 used for the template and 80–800 mW/mm2 used for Archons in (f,g), with light intensity adjusted to prevent signal saturation. (g) Population data of fluorescence changes, as in f, for these indicators (n=5, 6, and 4 cells for the template, Archon1, and Archon2, each from 2 independent transfections; individual data points in black dots; error bars, standard deviation; *P = 0.0155 for Archon1 and *P = 0.0374 for Archon2, Kruskal-Wallis analysis of variance followed by post-hoc Steel’s test with the template as control group), taken in the steady state.
Figure 2
Figure 2. Characterization of Archons in cultured cells
(a) Representative fluorescent images of Archon1 (left, excitation (λex) with 637 nm laser light, emission (λem) at 664LP) and GFP (right, λex = 475/34BP from an LED and λem = 527/50BP) channels in a cultured mouse hippocampal neuron (n = 32 cells from 5 independent transfections). Scale bar: 10 μm. (b) Relative fluorescence of QuasAr2, Archer1, Archon1, and Archon2 in cultured neurons (n = 18, 16, 23, and 23 cells respectively, from 4 independent transfections each, from one culture; λex = 637nm laser light at 800 mW/mm2 and λem = 664LP for Fig. 2c–g; ***P < 0.0001, Kruskal–Wallis analysis of variance followed by post-hoc Steel-Dwass test on each pair; see Supplementary Table 5 for full statistics for Fig. 2). Box plots with notches are used (see caption of Fig. 1d for description). Open circles represent outliers, data points which are less than 25th percentile or greater than 75th percentile by more than 1.5 times the interquartile range. (c) Representative fluorescence response of Archon1 in a cultured neuron, to a 100 mV change delivered in voltage-clamp. τfast and τslow indicate time constants with the fluorescence trace fit according to ΔFF(t)=Ae-t/τfast+Be-t/τslow, with the % indicating A/(A+B). Image acquisition rate: 3.2 kHz. (d) Representative fluorescence traces of Archon1 in response to a series of voltage steps in voltage-clamp mode. Image acquisition rate: 2.3 kHz. (e) Population data corresponding to the experiment of d (n = 8 neurons from 3 cultures). Data was normalized so that −70 mV was set to 0 ΔF/F. (f) Single-trial optical recording of Archon1 fluorescence responses (magenta) during spontaneous activity, with concurrent current clamp trace (black), for a cultured hippocampal neuron. Peak marked with arrow is zoomed-in in (g). Image acquisition rate: 2.3 kHz. (g) Zoomed-in view of peak marked with arrow in (f), scaled to match peaks. (h) Quantification of electrical and optical full width at half maximum (FWHM; dashed lines connect data points from same neuron), ΔF/F, and signal-to-noise ratio (SNR), per action potential (AP) across all recordings (n = 160 APs from 7 neurons from 5 cultures). *P = 0.0156, Wilcoxon signed-rank test. (i) Photobleaching curves of Ace, QuasAr2, Archer1, Archon1 and Archon2 under continuous illumination (n= 5, 7, 5, 9, and 7 neurons from 1, 1, 1, 2, and 2 cultures, respectively; 475/34BP from an LED at 13 mW/mm2 for Ace2N-4aa-mNeon, 637nm laser light at 2.2W/mm2 for QuasAr2 and Archer1, 637nm laser light at 800mW/mm2 for Archon1 and Archon2; light intensity was adjusted to have the same initial signal-to-noise ratio (SNR) of action potentials, e.g. 25±8, 26±12, 26±10, 26±10 and 28±7 for Quasar2, Archer1, Archon1, Archon2 and Ace2N-4aa-mNeon respectively; image acquisition rate: 333Hz); *P = 0.0184 for Archon1 and Archon2, Archon1 and QuasAr2, and Archon2 and QuasAr2; *P = 0.0456 for Archon1 and Archer1, Archon1 and Ace, and Archon2 and Ace; Kruskal–Wallis analysis of variance of bleaching time followed by post-hoc Steel-Dwass test on each pair).
Figure 3
Figure 3. Millivolt-scale imaging of neural voltage in intact brain slices
(a) Schematic of experimental recording configuration. Archon1-expressing pyramidal neurons in layer (L) 2/3 of motor cortex were targeted by patch-clamp recording, and Archon fluorescence at the soma was imaged at 1 kHz. Excitation intensity was ~7 mW over the area of the soma (i.e., ~15 W/mm2 at 637 nm, but 10x lower intensity, 1.5 W/mm2 at 637nm, was used in Fig. 3f for comparison). A bipolar stimulation electrode was in some experiments placed in L5 to trigger excitatory synaptic events in Archon1-expressing L2/3 pyramidal neurons. (b) Representative image of Archon1 expressing neuron in L2/3 of mouse motor cortex (n = 70 slices from 3 mice). Scale bar: 25 μm. (c) A series of 500 ms current steps with increasing amplitudes (from 100 to 600 pA, in 100pA increments; gray line) were injected through the recording pipette, resulting in action potentials of varying frequency. Magenta, imaged trace; black, simultaneous whole-cell patch-clamp in current clamp mode. (d) Zoomed-in view of APs marked with dotted box in c, scaled to match peaks. (e) Graph of the number of optically detected APs vs. the number of electrically detected APs for every 500 ms-long current injection across all cells that underwent the experiment of c (n = 22 steps from 5 neurons); straight line indicates linear regression. (f) Quantification of electrical and optical full width at half maximum (FWHM, left), ΔF/F (middle), and SNR (right) for action potentials; n = 10 neurons from 6 mice; means are plotted for each cell; dashed lines connect data points from same neuron; Wilcoxon signed-rank test: **P = 0.002 and ***P = 0.0002 for FWHM, P = 0.375 (not significant, n.s.) for ΔF/F, **P = 0.002 for SNR, see Supplementary Table 5 for full statistics for Fig. 3. (g) Representative optical (magenta) and electrical (black) signals from electrically evoked excitatory postsynaptic potentials (EPSPs). Arrows indicate times of stimulation (5 stimuli at 1 Hz, followed by inter-trial intervals of >30 seconds). (h) Population data of ΔF/F (left) and SNR (right) from individual EPSPs as in (g) across all cells (n = 45 EPSPs from 4 neurons from 2 mice); straight line indicates linear regression.
Figure 4
Figure 4. Voltage imaging of Archon1-expressing neurons in larval zebrafish
a Representative fluorescence image (top; GFP channel: excitation (λex) at 465 nm laser light, emission (λem) at 527/50BP) of neurons expressing zArchon1-EGFP in the spinal cord of a zebrafish larva at 3 days post fertilization (dpf) (n = 4 fish). Yellow boxes indicate neurons zoomed-in in the bottom panels. Scale bar, 125 μm. FB, forebrain; MB, midbrain; HB, hindbrain. (Bottom) From left to right: high magnification images of the neurons highlighted in the yellow boxes in the top panel. Scale bar, 5 μm. (b) Representative image (i, λex = 475/34BP from an LED, λem = 527/50BP) of neurons expressing zArchon1-GFP in the spinal cord of a 4 dpf zebrafish larva immobilized in agarose under wide-field microscopy (n = 5 fish). The yellow box indicates a neuron zoomed in in later panels. Scale bar: 100 μm. (ii) High magnification image of the neuron highlighted in the yellow box of (i) in the GFP channel. Scale bar: 10μm. (iii) As in ii, but in the Archon (λex = 637 nm laser light, λem = 664LP) channel. (c) Representative fluorescence trace (top) of zArchon1 reporting spontaneous activity of the neuron shown in b (at soma; λex = 637 nm laser light at 2.2 W/mm2, λem = 664LP; image acquisition rate: 500 Hz; n = 5 neurons from 5 fish). Bottom, the section of b highlighted in magenta, shown at an expanded time scale. (d) Population data of fluorescence changes and signal-to-noise ratios of zArchon1 during action potentials (APs; n = 21, 4, 132, 71 and 58 action potentials for fish 1–5, respectively; plotted is mean and standard deviation for each fish; raw data points are shown for fish with n <10 APs). (e) Photobleaching of zArchon1 fluorescence measured in in vivo in zebrafish larvae (n = 11 neurons from 6 fish) over 300 s of continuous illumination at 2.2 W/mm2. (f) Representative image (in the GFP channel) of neurons expressing zArchon1 in the spinal cord of a zebrafish larva at 4 dpf immobilized in agarose under wide-field microscopy (n = 3 fish). A yellow box indicates neurons zoomed in in later panels. Scale bar: 100μm. (ii) High magnification image of the neurons highlighted in the yellow box of (i) in the GFP channel. Scale bar: 10um. Highlighted regions indicate the soma (yellow) and the axon (red) of the neuron of interest. (iii) As in ii, but in the Archon channel. (g) Representative fluorescence trace of zArchon1 reporting spontaneous activity at the soma and the axon of the neuron shown in f (n = 3 neurons from 3 fish). The traces were acquired at the soma (yellow) and the axon (red) of the neuron (λex = 637 nm laser light at 2.2 W/mm2, λem = 664/LP, image acquisition rate: 250 Hz).
Figure 5
Figure 5. All-optical electrophysiology in C. elegans
(a) Schematic of AVA neuron expressing wArchon1-EGFP (red) and ASH neuron expressing ChR2-EGFP (green), in the head of C. elegans. A yellow arrow indicates synaptic connection from ASH onto AVA. (b) Fluorescence images of the C. elegans head expressing wArchon1-EGFP in an AVA neuron (under rig-3 promoter) and ChR2-GFP (under sra-6 promoter) in the ASH neuron (top, Archon channel; middle, GFP channel; bottom, overlay), as well as pharyngeal neurons that express wArchon1-EGFP under control of the rig-3 promoter (asterisks; n = 20 worms). Scale bar: 20 μm. (c; top) A representative trace of wArchon1 fluorescence reporting spontaneous activity in the soma of an AVA neuron (n = 20 cells from 20 worms). (Bottom) Individual traces of wArchon1 fluorescence reporting spontaneous activity in an AVA neuron (n=20 neurons in 20 worms). (d; top) A representative trace of wArchon1 fluorescence in soma of an AVA neuron under three pulses of blue light stimulation (0.2 mW/mm2, λex=475/34BP light from an LED, 6 s; blue bars). (Bottom) Individual traces of wArchon1 fluorescence in an AVA neuron under blue light illumination (n=20 neurons in 20 worms). (e) Averaged wArchon1 fluorescence changes for traces presented in panel d. Shaded area is standard deviation. (f) Averaged wArchon1 fluorescence changes for traces recorded under same conditions as in panel d using the worms expressing only wArchon1-EGFP in AVA neurons. Shaded area is standard deviation. (g) Photobleaching curve of wArchon1 expressed in AVA neurons under continuous 637 nm excitation illumination (n = 10 cells from 10 worms, λex = 637 nm laser light at 800 mW/mm2, λem = 664LP).

Similar articles

Cited by

References

    1. Packer MS, Liu DR. Methods for the directed evolution of proteins. Nat Rev Genet. 2015;16:379–394. - PubMed
    1. Subach FV, Piatkevich KD, Verkhusha VV. Directed molecular evolution to design advanced red fluorescent proteins. Nat Methods. 2011;8:1019–1026. - PMC - PubMed
    1. Chen TW, et al. Ultrasensitive fluorescent proteins for imaging neuronal activity. Nature. 2013;499:295–300. - PMC - PubMed
    1. Klapoetke NC, et al. Independent optical excitation of distinct neural populations. Nat Methods. 2014;11:338–46. - PMC - PubMed
    1. Zhao Y, et al. Microfluidic cell sorter-aided directed evolution of a protein-based calcium ion indicator with an inverted fluorescent response. Integr Biol (Camb) 2014;6:714–25. - PubMed

Publication types

MeSH terms

Substances