. 2018 Apr;21(4):598-606.
doi: 10.1038/s41593-018-0089-1. Epub 2018 Feb 26.

Feedback determines the structure of correlated variability in primary visual cortex

Affiliations

Feedback determines the structure of correlated variability in primary visual cortex

Adrian G Bondy et al. Nat Neurosci. 2018 Apr.

Abstract

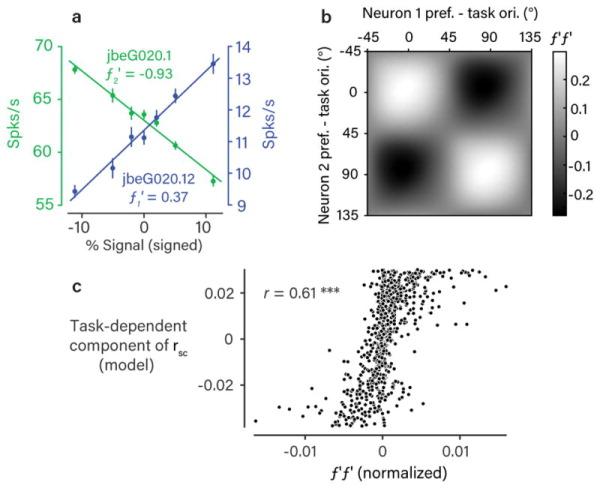
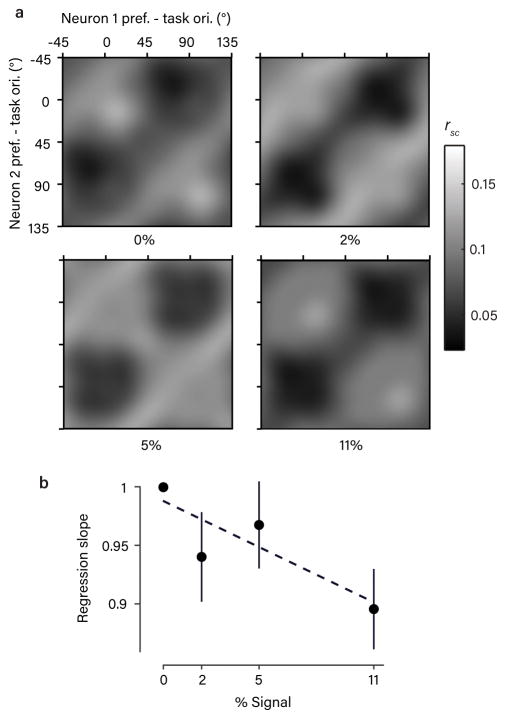
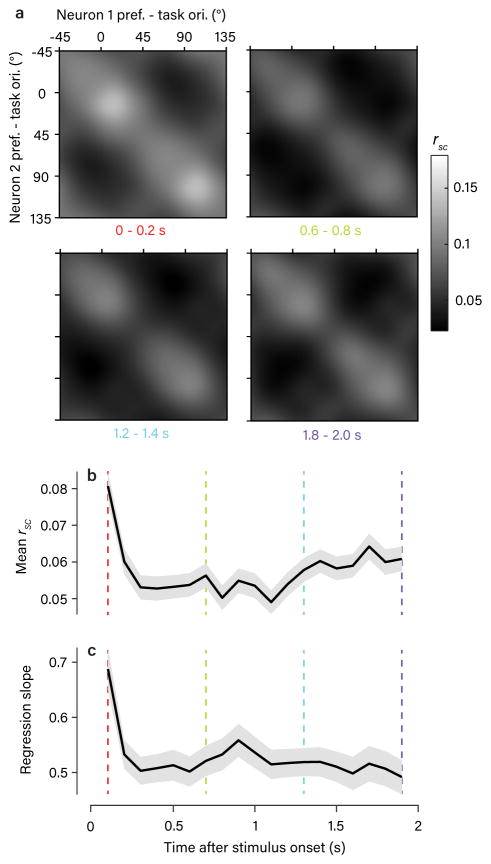
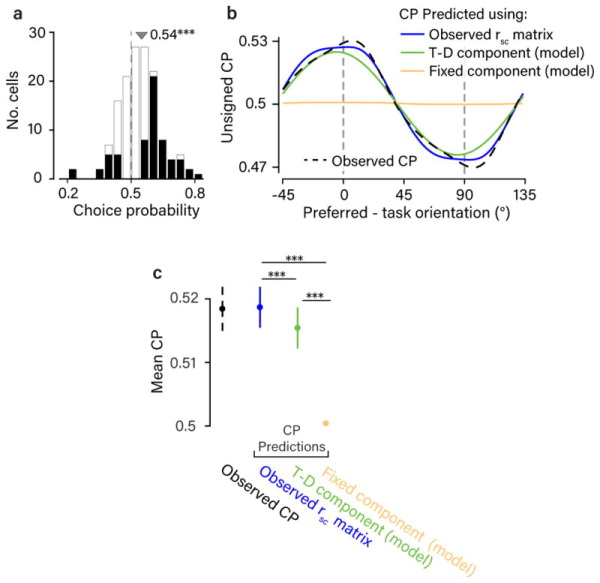
The variable responses of sensory neurons tend to be weakly correlated (spike-count correlation, rsc). This is widely thought to reflect noise in shared afferents, in which case rsc can limit the reliability of sensory coding. However, it could also be due to feedback from higher-order brain regions. Currently, the relative contributions of these sources are unknown. We addressed this by recording from populations of V1 neurons in macaques performing different discrimination tasks involving the same visual input. We found that the structure of rsc (the way rsc varied with neuronal stimulus preference) changed systematically with task instruction. Therefore, even at the earliest stage in the cortical visual hierarchy, rsc structure during task performance primarily reflects feedback dynamics. Consequently, previous proposals for how rsc constrains sensory processing need not apply. Furthermore, we show that correlations between the activity of single neurons and choice depend on feedback engaged by the task.


Conflict of interest statement

Competing Financial Interests

The authors declare no competing financial interests.

Figures

Figure 1
Figure 1. Orthogonal orientation discrimination task
a. Schematic illustration of the task. Two example task contexts shown (cardinal and oblique discriminations). The task context was fixed in a given recording session, but varied across sessions. b. Psychometric function for monkey ‘lem’, example session, n=1,354 trials. Black curve is a probit fit, and error bars are 95% confidence intervals around the mean (black points). c. Histograms showing the distribution of psychometric thresholds across sessions for the two subjects. Threshold is defined as the signal level eliciting 75% correct performance. Black triangle indicates the threshold corresponding to the example session in (b). d. Example single stimulus frames corresponding to the two example task contexts in (a). The stimuli consisted of dynamic, white noise filtered in the Fourier domain for orientation (see Methods). The filter was centered on one of the two task orientations and its bandwidth determined signal strength.
Figure 2
Figure 2. Rsc structure in V1 depends systematically on task context
a,c. Observed rsc matrices for the two subsets of sessions grouped by task context, as indicated in (b). The matrices were obtained by pooling the set of rsc measurements made within each subset and applying a von Mises smoothing kernel (approximating a 2D wrapped Gaussian with 15º s.d.). Colored dots correspond to pairs preferring the same or opposing task orientations. b. Polar histogram shows the distribution of task contexts used across sessions, with color indicating the division into two subsets. Note that the period is 90º because of the orthogonality of the discriminanda. Colored arrows indicate the mean task context associated with each subset. d. Scatter plot showing a weak, but significant, dependence of rsc on the difference in preferred orientation of neuronal pairs (Pearson’s r = –0.11, P = 9 × 10⁻⁴, bootstrap test, one-sided). Black line is (type II) regression line and grey line corresponds to rsc=0. e. Average rsc matrix observed across all session, shown in a task-aligned coordinate frame. Each pair’s preferred orientations are expressed relative to the task orientations (defined as 0º and 90º). Color scale as in (a). f. Scatter plot showing a significant dependence of rsc on distance from the peak (0º/0º or 90º/90º) in the matrix in (e). This dependence was stronger than the dependence on difference in preferred orientation (r=−0.17, p=1.63*10−6, bootstrap test, one-sided), suggesting the task-aligned pattern we observed captures a more important feature of rsc structure. Black and grey lines as in (d).
Figure 3
Figure 3. Segregating fixed and task-dependent components of rsc structure
a. Schematic of the regression model used to estimate fixed and task-dependent components of rsc structure. Each component was a matrix composed of a grid of 8×8 von Mises basis functions, with amplitudes fit to the observed rsc measurements. b. Goodness-of-fit for the model that included both components and for two reduced models that included only one of the two components. Values are expressed relative to an estimate of the explainable variance in the data (see Methods). Error bars are +/− 1 SEM obtained from repeated 50-fold cross-validation. Statistical differences in goodness-of-fit (p<0.001 in all cases) were based on a one-sided test obtained in the same way. c,d. Estimated components from the combined model. The amplitude of the task-dependent component (c) was considerably larger than the fixed component (d) by a factor of 2.1 (computed using the varance across the fitted basis function amplitudes), and closely resembled the lattice-like shape of the task-aligned, average rsc matrix (Fig. 2e). Note that orientation preferences for the task-dependent component are expressed relative to the task orientations. Mean rsc values are close to 0 due to the inclusion of a model constant.
Figure 4
Figure 4. Rsc structure during task performance reflects a single mode of variability
a. Eigenspectrum for the average, task-aligned rsc matrix in Fig. 2e. The largest eigenvalue exceeded chance (p<0.001, permutation test, one-sided). The chance distribution (mean +/− 1 SEM in blue) was determined by adding a random offset to the preferred orientations of each of the 811 pairs (i.e. permuting each rsc value along the diagonal). b. The eigenvector corresponding to the largest eigenvalue in (a). We first removed the mean rsc value from the matrices to ignore any flat eigenvectors. Error bar is +/− bootstrap SEM. The dark gray vertical bar indicates the peak in the eigenvector +/− 1 bootstrap SEM. This was not significantly different from 0º (p=0.078, bootstrap test, one-sided), indicating close alignment with the task. c. Schematic of “single eigenvector” model, in which rsc structure is described as the outer product of a vector parameterized as the difference between two von Mises functions 90° apart. d. Schematic of the “diagonal ridge” model in which rsc structure depended only on the difference in preferred orientations, independent of task. This dependence was modeled as a von Mises function centered on zero. e. Goodness-of-fit for the models in (c) and (d), calculated as normalized % variance explained, as in Fig. 3. Error bars around the mean and statistical comparison between models obtained through repeated 50-fold cross-validation of the set of 811 pairs.
Figure 5
Figure 5. Rsc structure matches effect of task-related stimulus variability
a. Responses (mean +/− 1 SEM, n=1,049 trials) to the stimuli used in the task at various signal strengths for two example neurons. For the purposes of illustration, the two task orientations are simply labeled positive and negative. This pair was typical in that the response functions (f1 and f2) are approximately linear over the range of signal strengths used. For this reason, we calculated the response correlation introduced by tuning similarity as the normalized product of the derivatives f1′f2 . b. The matrix of f′f′ values, as a function of task-aligned pairwise orientation preference, obtained using kernel smoothing as in Fig. 2. We observed a pattern that was very similar to the structure of rsc we observed during task performance (Fig. 2e). c. Scatter plot of the task-dependent (putatively top-down) component of rsc (Fig. 3c) against normalized f′f′ values for each recorded neuronal pair. The two were highly correlated across the population (Pearson’s r=0.61, p<0.001, bootstrap test, one-sided).
Figure 6
Figure 6. Rsc structure depends on variability in choice
a. The average, task-aligned rsc matrix (as in Fig. 2e), shown separately for each stimulus strength. Note that 0% signal trials involved statistically identical stimuli across all task contexts. A qualitatively similar structure was apparent at non-zero signal levels. (Spike counts were z-scored to eliminate the effect of stimulus drive; see Methods). b. Scatter plot showing the slope of a regression line comparing the rsc values measured at each signal level against the rsc values measured at the 0% signal level. This quantity indicates the degree of attenuation of the rsc structure at a given signal level. We observed a weak but significant negative correlation (Pearsons’s r, p=0.038, bootstrap test, one-sided) with signal strength (error bars are +/− 1 bootstrap SEM around the mean of the 811 pairs), implying the rsc structure is attenuated on high-signal trials, when there was also less variability in choice. Dotted line is fitted regression line.
Figure 7
Figure 7. Temporal dynamics of rsc structure
a. The average, task-aligned rsc matrix (as in Fig. 2e) obtained using spike counts from 200-ms windows during the stimulus presentation. A similar structure was present at all time points (4 examples shown). b–c. Plots showing the temporal dynamics of two statistical measures of the observed rsc structure (mean +/− 1 bootstrap SEM). The colored lines indicate the example time points shown in (a). The population mean rsc value (b) showed a sharp drop shortly after stimulus onset, as seen in other studies, and then a gradual recovery over the course of the trial. The amplitude of the rsc structure, quantified using the slope of the regression line of rsc obtained in each 200-ms window against rsc obtained from trial-length spike counts, is in (c). Apart from an increase at the first time point, likely due to the onset of the visual stimulus, this showed no significant modulation over the course of the trial. Note that values are all significantly less than 1 because smaller counting windows introduced a source of uncorrelated noise across trials.
Figure 8
Figure 8. The task-dependent component of rsc structure accounts for choice-related activity
a. Histogram of observed CPs, from the subset of neurons (n=144) significantly preferring one of the two task orientations (d′>0.9 at highest signal level). Mean CP of 0.54 exceeded chance (p<0.001, bootstrap test using cell resampling, one-sided). CPs that were individually significant (p<0.05, bootstrap test using trial resampling, one-sided) are shown in black. b. We tested the known analytical relationship between spike-count correlations, readout weights, and CPs, under the assumption of a linear decoder applied to a population of sensory neurons (see Methods). Here CP is defined as a continuous function of task-aligned preferred orientation, analogous to our description of the rsc matrix in Fig. 2e. The dashed black line shows the profile of CP observed across preferred orientations, after smoothing with a von Mises kernel approximating a wrapped Gaussian with 10° s.d. We applied a fixed sign convention to the CP values across all neurons, equivalent to arbitrarily calling the 0°-choice the preferred one. The predicted CP profiles (solid lines) show the CP elicited by reading out a sensory population with different rsc structures. Readout weights across orientations were unobserved and the profiles shown are averages of a large set generated from different assumed readout weight profiles (see Methods). c. Mean CP (using the traditional sign convention) associated with the profiles in (b), +/− 1 bootstrap SEM obtained by cell resampling (n=811 neurons). Note that the mean CP shown here is different to the one shown in (a) because all neurons are included, regardless of their orientation preference. Statistical comparisons were performed using a sign-rank test.

References

    1. Tomko GJ, Crapper DR. Neuronal variability: non-stationary responses to identical visual stimuli. Brain Res. 1974;79:405–418. - PubMed
    1. Henry GH, Bishop PO, Tupper RM, Dreher B. Orientation specificity and response variability of cells in the striate cortex. Vision Res. 1973;13:1771–1779. - PubMed
    1. Cohen MR, Kohn A. Measuring and interpreting neuronal correlations. Nat Neurosci. 2011;14:811–9. - PMC - PubMed
    1. Shadlen MN, Newsome WT. The variable discharge of cortical neurons: implications for connectivity, computation, and information coding. J Neurosci. 1998;18:3870–3896. - PMC - PubMed
    1. Sompolinsky H, Yoon H, Kang K, Shamir M. Population coding in neuronal systems with correlated noise. Phys RevE. 2001;64:51904. - PubMed

Publication types