

Two predominant MUPs, OBP3 and MUP13, are male pheromones in rats
- PMID: 29483934
- PMCID: PMC5824612
- DOI: 10.1186/s12983-018-0254-0
Two predominant MUPs, OBP3 and MUP13, are male pheromones in rats
Abstract
Background: In rats, urine-borne male pheromones comprise organic volatile compounds and major urinary proteins (MUPs). A number of volatile pheromones have been reported, but no MUP pheromones have been identified in rat urine.
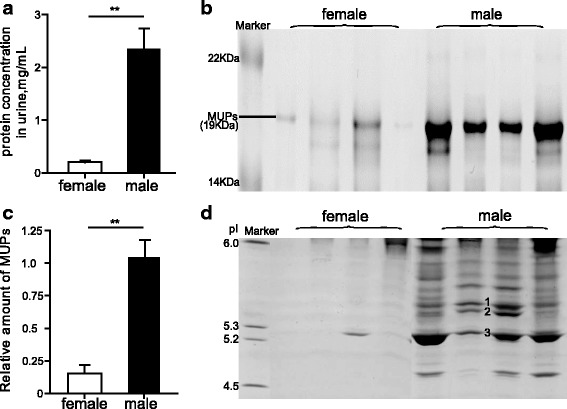
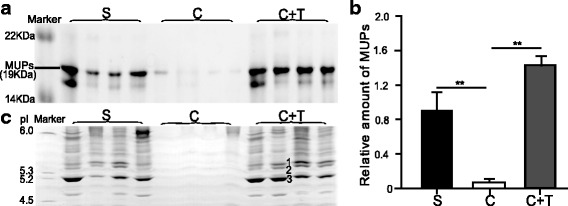
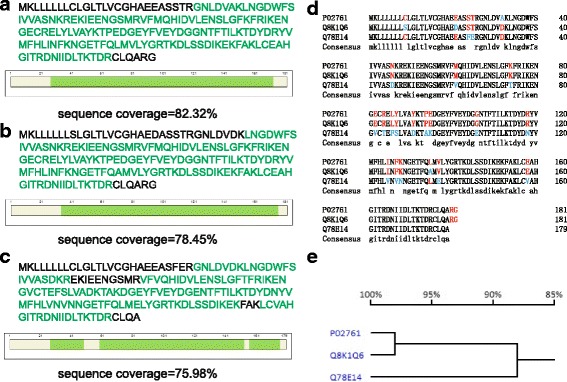
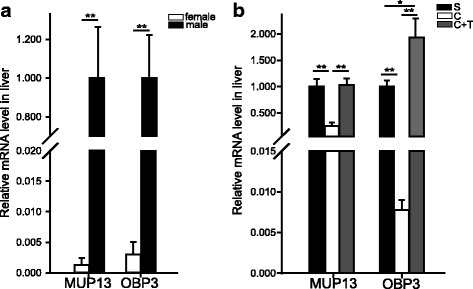
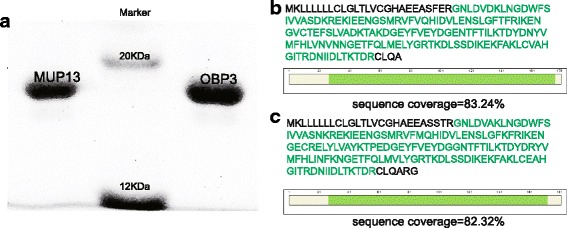
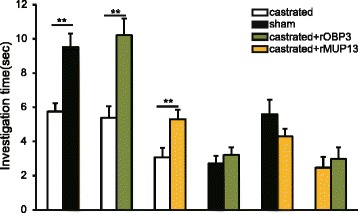
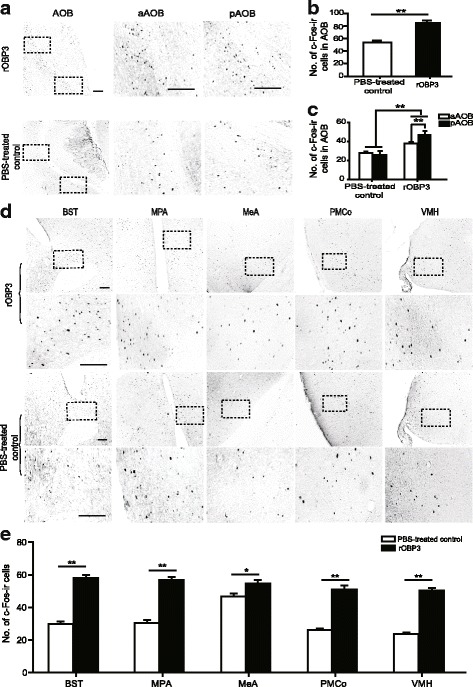
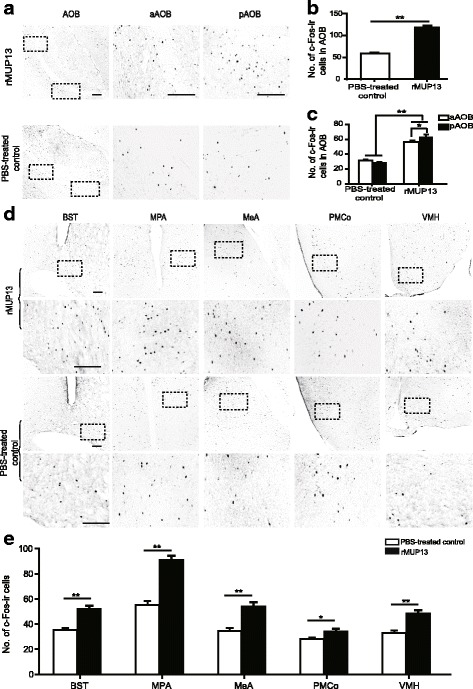
Results: We used sodium dodecyl sulphate-polyacrylamide gel electrophoresis (SDS-PAGE), isoelectric focusing electrophoresis (IEF), nano-liquid chromatography-tandem mass spectrometry (nLC-MS/MS) after in gel digestion of the proteins and quantitative real-time PCR (qRT-PCR) and showed that the levels of two MUPs, odorant-binding protein 3 (OBP3) (i.e. PGCL4) and MUP13 (i.e. PGCL1), in urine and their mRNAs in liver were higher in males than in females and were suppressed by orchidectomy and restored by testosterone treatment (T treatment). We then generated recombinant MUPs (rMUPs) and found that the sexual attractiveness of urine from castrated males to females significantly increased after the addition of either recombinant OBP3 (rOBP3) or recombinant MUP13 (rMUP13). Using c-Fos immunohistochemistry, we further examined neuronal activation in the brains of female rats after they sniffed rOBP3 or rMUP13. Both rOBP3 and rMUP13 activated the accessory olfactory bulb (AOB), medial preoptic area (MPA), bed nucleus of the stria terminalis (BST), medial amygdala (MeA), posteromedial cortical amygdala (PMCo) and ventromedial nucleus of the hypothalamus (VMH), which participate in the neural circuits responsible for pheromone-induced sexual behaviours. In particular, more c-Fos-immunopositive (c-Fos-ir) cells were observed in the posterior AOB than in the anterior AOB.
Conclusions: The expression of OBP3 and MUP13 was male-biased and androgen-dependent. They attracted females and activated brain areas related to sexual behaviours in female rats, suggesting that both OBP3 and MUP13 are male pheromones in rats. Particularly, an OBP excreted into urine was exemplified to be a chemical signal.
Keywords: Activation of neural pathways; Female attraction; MUPs; Male pheromones.
Conflict of interest statement
The procedures for animal care and use were performed in strict accordance with the guidelines of the Animal Use Committee of the Institute of Zoology, Chinese Academy of Sciences (IOZ 2015).Not applicable.The authors declare that they have no competing interests.Springer Nature remains neutral with regard to jurisdictional claims in published maps and institutional affiliations.
Figures
Similar articles
-
Two Preputial Gland-Secreted Pheromones Evoke Sexually Dimorphic Neural Pathways in the Mouse Vomeronasal System.Front Cell Neurosci. 2019 Oct 2;13:455. doi: 10.3389/fncel.2019.00455. eCollection 2019. Front Cell Neurosci. 2019. PMID: 31632243 Free PMC article.
-
Sex difference and testosterone modulation of pheromone-induced NeuronalFos in the Ferret's main olfactory bulb and hypothalamus.Biol Reprod. 1998 Dec;59(6):1454-63. doi: 10.1095/biolreprod59.6.1454. Biol Reprod. 1998. PMID: 9828192
-
Sex comparison of neuronal Fos immunoreactivity in the rat vomeronasal projection circuit after chemosensory stimulation.Neuroscience. 1996 Apr;71(4):1063-72. doi: 10.1016/0306-4522(95)00493-9. Neuroscience. 1996. PMID: 8684610
-
From sexual attraction to maternal aggression: when pheromones change their behavioural significance.Horm Behav. 2015 Feb;68:65-76. doi: 10.1016/j.yhbeh.2014.08.007. Epub 2014 Aug 23. Horm Behav. 2015. PMID: 25161057 Review.
-
Major urinary protein regulation of chemical communication and nutrient metabolism.Vitam Horm. 2010;83:151-63. doi: 10.1016/S0083-6729(10)83006-7. Vitam Horm. 2010. PMID: 20831945 Free PMC article. Review.
Cited by
-
Brain-Wide Synaptic Inputs to Aromatase-Expressing Neurons in the Medial Amygdala Suggest Complex Circuitry for Modulating Social Behavior.eNeuro. 2022 Mar 11;9(2):ENEURO.0329-21.2021. doi: 10.1523/ENEURO.0329-21.2021. Print 2022 Mar-Apr. eNeuro. 2022. PMID: 35074828 Free PMC article.
-
Species recognition and the divergences in the chemical and ultrasonic signals between two coexisting Rattus species.Curr Zool. 2023 Aug 1;70(4):531-538. doi: 10.1093/cz/zoad035. eCollection 2024 Aug. Curr Zool. 2023. PMID: 39176055 Free PMC article.
-
Disrupting the DREAM transcriptional repressor complex induces apolipoprotein overexpression and systemic amyloidosis in mice.J Clin Invest. 2021 Feb 15;131(4):e140903. doi: 10.1172/JCI140903. J Clin Invest. 2021. PMID: 33444292 Free PMC article.
-
Nephrotoxicity evaluation and proteomic analysis in kidneys of rats exposed to thioacetamide.Sci Rep. 2022 Apr 27;12(1):6837. doi: 10.1038/s41598-022-11011-3. Sci Rep. 2022. PMID: 35477741 Free PMC article.
-
Male pheromones and their reception by females are co-adapted to affect mating success in two subspecies of brown rats.Curr Zool. 2020 Oct 23;67(4):371-382. doi: 10.1093/cz/zoaa066. eCollection 2021 Aug. Curr Zool. 2020. PMID: 34671704 Free PMC article.
References
LinkOut - more resources
Full Text Sources
Other Literature Sources
Molecular Biology Databases
