. 2018 Jan 2;9(7):7282-7297.
doi: 10.18632/oncotarget.23837. eCollection 2018 Jan 26.

Inhibition of Mdmx (Mdm4) in vivo induces anti-obesity effects

Affiliations

Inhibition of Mdmx (Mdm4) in vivo induces anti-obesity effects

Ning Kon et al. Oncotarget. .

Abstract

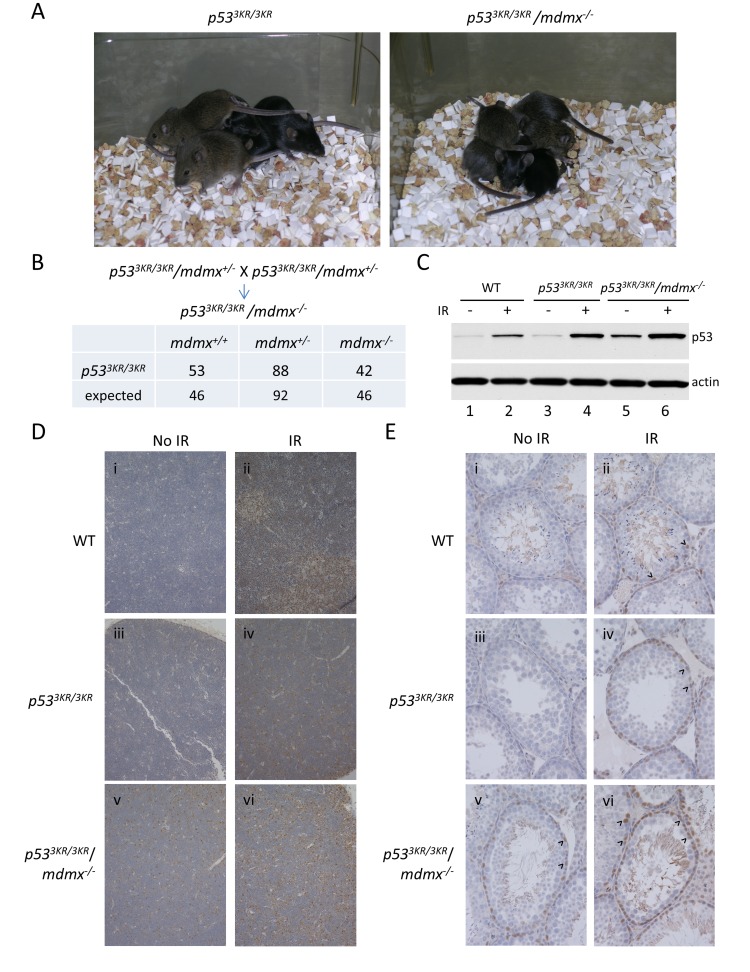
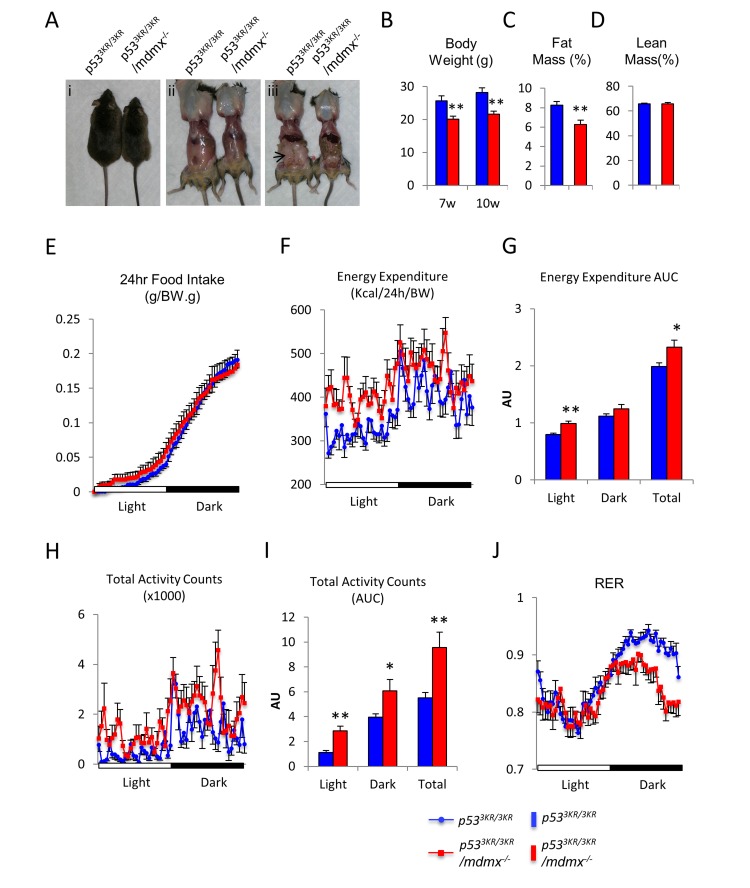
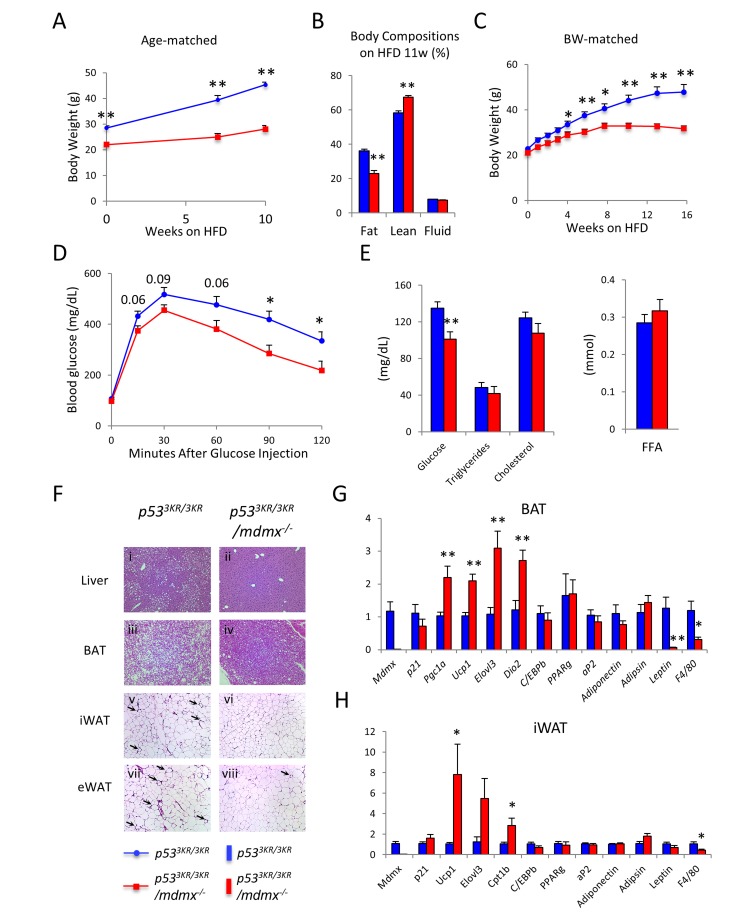
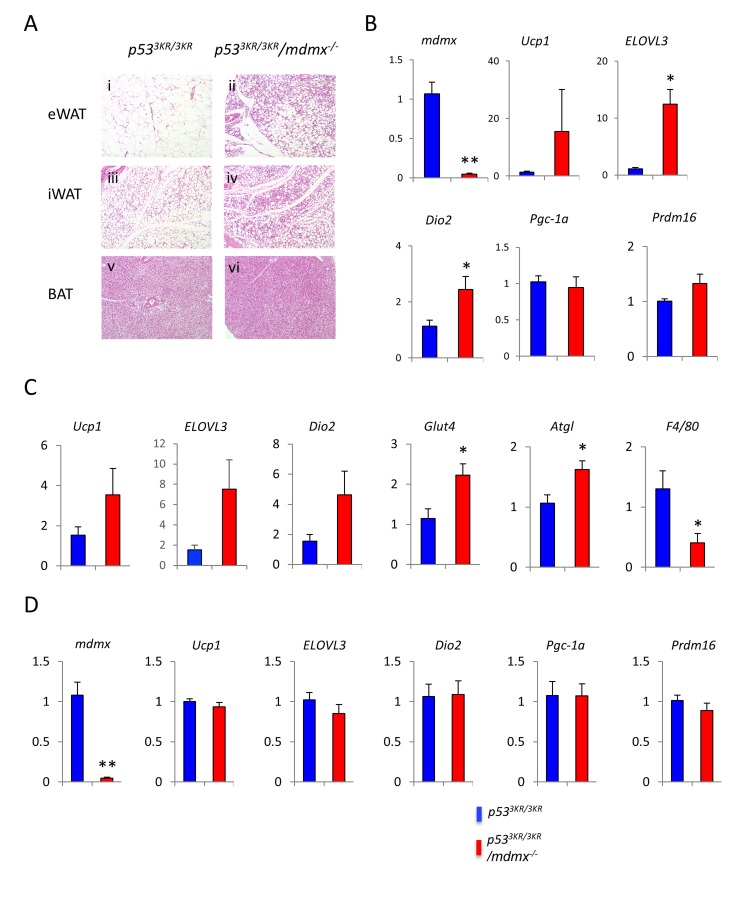
Although cell-cycle arrest, senescence and apoptosis remain as major canonical activities of p53 in tumor suppression, the emerging role of p53 in metabolism has been a topic of great interest. Nevertheless, it is not completely understood how p53-mediated metabolic activities are regulated in vivo and whether this part of the activities has an independent role beyond tumor suppression. Mdmx (also called Mdm4), like Mdm2, acts as a major suppressor of p53 but the embryonic lethality of mdmx-null mice creates difficulties to evaluate its physiological significance in metabolism. Here, we report that the embryonic lethality caused by the deficiency of mdmx, in contrast to the case for mdm2, is fully rescued in the background of p533KR/3KR , an acetylation-defective mutant unable to induce cell-cycle arrest, senescence and apoptosis. p533KR/3KR/mdmx-/- mice are healthy but skinny without obvious developmental defects. p533KR/3KR/mdmx-/- mice are resistant to fat accumulation in adipose tissues upon high fat diet. Notably, the levels of p53 protein are only slightly increased and can be further induced upon DNA damage in p533KR/3KR/mdmx-/- mice, suggesting that Mdmx is only partially required for p53 degradation in vivo. Further analyses indicate that the anti-obesity phenotypes in p533KR/3KR/mdmx-/- mice are caused by activation of lipid oxidation and thermogenic programs in adipose tissues. These results demonstrate the specific effects of the p53/Mdmx axis in lipid metabolism and adipose tissue remodeling and reveal a surprising role of Mdmx inhibition in anti-obesity effects beyond, commonly expected, tumor suppression. Thus, our study has significant implications regarding Mdmx inhibitors in the treatment of obesity related diseases.

Keywords: Mdm4; Mdmx; adipose tissues; metabolism; p53.


Conflict of interest statement

CONFLICTS OF INTEREST The authors declare no competing financial interests.

Figures

Figure 1
Figure 1. The embryonic lethality of mdmx knockout is rescued by p53 3KR mutation, and p53 3KR protein has increased stability in the absence of Mdmx
A. The representative pictures of p533KR/3KR and p533KR/3KR/mdmx-/- mice at weaning. B. Intercross of p533KR/3KR/mdmx+/- mice. The numbers of the resulting progeny are listed in the table. The expected numbers of progeny of different genotypes are based on the total number of progeny from the cross. C. Western Blotting of the protein extracts of thymi from wild-type, p533KR/3KR, and p533KR/3KR/mdmx-/- mice treated without (lanes 1, 3, and 5) or with (lanes 2, 4, and 6) ionizing radiation. D. Immunohistochemical staining of p53 in thymus from i and ii, wild-type; iii and iv, p533KR/3KR; v and vi, p533KR/3KR/mdmx-/- mice treated without (i, ii, iii) or with (ii, iv, vi) radiation. E. Immunohistochemical staining of p53 in testis from 2-month-old i and ii, wild-type; iii and iv, p533KR/3KR; v and vi, p533KR/3KR/mdmx-/- mice treated without (i, ii, iii) or with (ii, iv, vi) ionizing radiation.
Figure 2
Figure 2. p533KR/3KR/mdmx-/- mice have reduced body fat
A. Gross appearances of 4-month-old p533KR/3KR and p533KR/3KR/mdmx-/- mice and dissection to reveal body fat. Arrow in iii indicates the prominent epididymal fat in p533KR/3KR mice. B. Comparisons of body weight. C. Measurements of fat mass content and D. Measurements of lean mass content in male mice at 10 weeks of age (n = 7, 5). E.-J. Calorimetric analyses of p533KR/3KR/mdmx-/- mice (n = 8) and p533KR/3KR mice (n = 8). E. Normalized food intake during a period of 24 hours. F. Recording of the energy expenditure during a period of 24 hours. G. Area under curve (AUC) of energy expenditure. H. Recording of total activity counts during a period of 24 hours. I. Area under curve (AUC) of total activity counts. J. Recording of respiratory exchange ratio (RER) during a period of 24 hours. * represents p < 0.05, ** represents p < 0.01. Data are represented as mean ± SEM.
Figure 3
Figure 3. p533KR/3KR/mdmx-/- mice resist diet-induced obesity
A. Body weight curve of age-matched p533KR/3KR (n = 11) and p533KR/3KR/mdmx-/- mice (n = 8) on high fat diet. B. Body composition of mice used in (A) after 10 weeks on HFD. C. Average body weight curve of weight-matched p533KR/3KR and p533KR/3KR/mdmx-/- mice on HFD (n = 5, 5). D. Glucose tolerance test on mice after 10 weeks on HFD. E. Plasma levels of glucose, triglycerides, cholesterol, and free fatty acids in mice after 12 weeks HFD feeding. Mice were sacrificed after overnight fasting (n = 6, 6). F. Histopathological analysis of p533KR/3KR and p533KR/3KR/mdmx-/- mice on HFD. p533KR/3KR (i, iii, v, and vii) and p533KR/3KR/mdmx-/- (ii, iv, vi, and viii) mice. i and ii, liver; iii and iv, brown adipose tissue (BAT); v and vi, subcutaneous inguinal white adipose tissue (iWAT); vii and viii, visceral epididymal white adipose tissue (eWAT). Arrows indicate the “crown” like structures associated with macrophage infiltration. G. Relative expression levels of genes of interest in BAT (n = 6, 6). H. Relative expression levels of genes of interest in iWAT (n = 6, 6). *p < 0.05, **p < 0.01. Data are represented as mean ± SEM.
Figure 4
Figure 4. Increased thermogenic response in p533KR/3KR/mdmx-/- mice
4-month old male mice were exposed to 4 °C for 4 days. A. Histology of adipose tissues from p533KR/3KR (i, iii, and v) and p533KR/3KR/mdmx-/- (ii, iv, and vi) mice on high fat diet. B. Relative expression levels of genes of interest in eWAT. C. Relative expression levels of genes of interest in iWAT. D. Relative expression levels of genes of interest in BAT. *p < 0.05, **p < 0.01 (n = 7, 5). Data are represented as mean ± SEM.
Figure 5
Figure 5. ELOVL3 is a transcriptional target of p53
A. The p53 dependent expression of ELOVL family genes was measured by qPCR. The expression of p53 was induced by doxycycline in inducible H1299 p53 stable cell line. B. Western blot to determine the levels of ELOVL3 and p53 target genes p21 and MDM2 expression before and after induced p53 expression by doxycycline in inducible H1299 p53 stable cell line. C. Relative expression levels of ELOVL3 were determined by qPCR after transient expression of wild-type p53 or mutant p53 R175H. Transfection with empty vector was used as control. D. Regions of ELOVL3 promoter were tested for p53 binding by qChIP using control IgG and anti-p53 antibody. E. Electro mobility shift assay was performed by using probes containing full length or partially deleted ELOVL3 promoter. F. Luciferase assay using full length ELOVL3 promoter (pLucB) or partially deleted ELOVL3 promoter (pLucA) after transfection of increasing levels of p53, or mutant p53-R175H for 24 hours. G. Luciferase assay using luciferase expression vector with full length (pLucB) or partially deleted (pLucB Δ) ELOVL3 promoter in the absence or presence of p53 expression. H. Relative levels of ELOVL3 upon DNA damage determined by qPCR after H460 cells were treated with 1 uM doxorubicin for 12, 24 or 36 hrs. I. Control or p53 knockdown H460 cells were treated with or without 1 uM doxorubicin for 24 hrs. The expression of ELOVL3 and p53 target gene p21 was determined by qPCR. * represents p < 0.05;** represents p < 0.01.

Similar articles

Cited by

References

    1. Kruse JP, Gu W. Modes of p53 regulation. Cell. 2009;137:609–22. doi: S0092-8674(09)00511-X. - PMC - PubMed
    1. Vousden KH, Prives C. Blinded by the Light: The Growing Complexity of p53. Cell. 2009;137:413–31. doi: 10.1016/j.cell.2009.04.037. - DOI - PubMed
    1. Kruiswijk F, Labuschagne CF, Vousden KH. p53 in survival, death and metabolic health: a lifeguard with a licence to kill. Nat Rev Mol Cell Biol. 2015;16:393–405. doi: 10.1038/nrm4007. - DOI - PubMed
    1. Eischen CM. Role of Mdm2 and Mdmx in DNA repair. J Mol Cell Biol. 2017;9:69–73. doi: 10.1093/jmcb/mjw052. - DOI - PMC - PubMed
    1. Brooks CL, Gu W. New insights into p53 activation. Cell Res. 2010;20:614–21. doi: 10.1038/cr.2010.53. - DOI - PMC - PubMed