. 2018 May;41(5):2573-2588.
doi: 10.3892/ijmm.2018.3512. Epub 2018 Feb 23.

Inhibition of cell migration by focal adhesion kinase: Time-dependent difference in integrin-induced signaling between endothelial and hepatoblastoma cells

Affiliations

Inhibition of cell migration by focal adhesion kinase: Time-dependent difference in integrin-induced signaling between endothelial and hepatoblastoma cells

Hongchi Yu et al. Int J Mol Med. 2018 May.

Abstract

angiogenesis plays an important role in the development and progression of tumors, and it involves a series of signaling pathways contributing to the migration of endothelial cells for vascularization and to the invasion of cancer cells for secondary tumor formation. Among these pathways, the focal adhesion kinase (FAK) signaling cascade has been implicated in a variety of human cancers in connection with cell adhesion and migration events leading to tumor angiogenesis, metastasis and invasion. Therefore, the inhibition of FAK in endothelial and/or cancer cells is a potential target for anti‑angiogenic therapy. In the present study, a small‑molecule FAK inhibitor, 1,2,4,5-benzenetetramine tetrahydrochloride (Y15), was used to study the effects of FAK inhibition on the adhesion and migration behaviors of vascular endothelial cells (VECs) and human hepatoblastoma cells. Furthermore, the time-dependent differences in proteins associated with the integrin-mediated FAK/Rho GTPases signaling pathway within 2 h were examined. The results indicated that the inhibition of FAK significantly decreased the migration ability of VECs and human hepatoblastoma cells in a dose-dependent manner. Inhibition of FAK promoted cell detachment by decreasing the expression of focal adhesion components, and blocked cell motility by reducing the level of Rho GTPases. However, the expression of crucial proteins involved in integrin-induced signaling in two cell lines exhibited a time-dependent difference with increased duration of FAK inhibitor treatment, suggesting different mechanisms of FAK-mediated cell migration behavior. These results suggest that the mechanism underlying FAK-mediated adhesion and migration behavior differs among various cells, which is expected to provide evidence for future FAK therapy targeted against tumor angiogenesis.


Conflict of interest statement

Competing interests

The authors declare that they have no competing interests.

Figures

Figure 1
Figure 1
Inhibition of focal adhesion kinase (FAK) blocked endothelial and hepatoblastoma cell migration in a concentration-dependent manner. Effect of the FAK inhibitor Y15 at increasing concentrations on the migration of (A) endothelial cells and (C) hepatoblastoma cells; scale bar, 500 µm. Statistical analysis of the mean cell migration distance of (B) endothelial cells and (D) hepatoblastoma cells in three independent experiments. *P<0.05 denotes a statistically significant difference. The mean ± standard error of three independent experiments are shown.
Figure 2
Figure 2
Detailed images of focal adhesion kinase (FAK) inhibitor (Y15) inhibition of cell migration using (A) Transwell assay for 24 h and (C) scratch wound assays within 2 h. (A) Migrating EA.hy926 and HepG2 cells with or without 50 µmol/ml Y15 for 24 h by Transwell assay (×10 magnification); scale bar, 100 µm. (B) Statistical analysis of migrating cells numbers in one field of vision.*P<0.05 vs. controls. The mean ± standard error of three independent experiments are shown. (C) Detailed images of FAK inhibition with 50 µM Y15 blocking cell migration within 2 h. Cell migration of EA.hy926 and HepG2 cells with FAK inhibition within 2 h by scratch wound assay. The dotted lines denote the baseline of the scratch wound; the white arrows indicate the visible migrated cells in the two control groups; scale bar, 100 µm.
Figure 3
Figure 3
Effect of treatment with 50 µM focal adhesion kinase (FAK) inhibitor (Y15) on the distribution of F-actin in Ea.hy926 and HepG2 cells. Confocal immunofluorescence images of (A) EA.hy926 and (B) HepG2 cells, showing changes in the localization of F-actin (green, F-actin; blue, nucleus) in response to 50 µM Y15 for 2 h; scale bar, 20 µm. The designated region indicated by the red square frames was enlarged to show the detailed fiber structure in the cell body. Inhibition of FAK induced retraction of filopodia and lamellipodia in the cell protrusions, resulting in formation of stress fiber structures (yellow arrows) in the cell bodies.
Figure 4
Figure 4
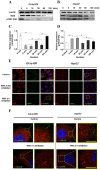
Expression level of total focal adhesion kinase (tFAK) and phosphorylated FAK (pFAK) with inhibition of FAK. (A and B) Time-dependent effect of the FAK inhibitor Y15 on the expression of tFAK and pFAK in endothelial cells and hepatoblastoma cells, respectively, within 2 h. Quantification of pFAK in tFAK expression by image analysis of the western blot bands in (C) endothelial cells and (D) hepatoblastoma cells. Values represent the mean ± standard deviation, n=4. *P<0.05 denotes a statistically significant difference compared with the other groups. (E) Double-labeled immunofluorescence analyzed the effects of distribution and expression of pFAK (green) and tFAK (red) proteins with inhibition of FAK after 5 min and 2 h (blue, DAPI stained nucleus); scale bar, 20 µm. (F) Enlarged images of designated regions, labeled by white square frames in (E); the green arrows indicate clear distribution of pFAK at the leading edge of the cells, while FAK with red fluorescence occupied the whole cytoplasm with 2 h FAK inhibition. A lower degree of green fluorescence may be observed at the cell periphery; scale bar, 2.5 µm.
Figure 5
Figure 5
Inhibition of focal adhesion kinase (FAK) regulates the changes in the expression of integrin α and β subunits in endothelial EA.hy926 and hepatoblastoma HepG2 cells. Expression level of integrins α2, α5, αV, β1 and β3 with FAK inhibitor treatment within 2 h in (A) endothelial cells and (B) hepatoblastoma cells. (C and D) Quantification of each integrin subunit expression level by image analysis of the western blot bands in (A and B). The expression level of β-actin in each group was used as an internal control, and the relative expressions of integrins were calculated. Data are presented as means ± standard error of the mean from three independent experiments. *P<0.05 denotes statistically significant differences.
Figure 6
Figure 6
Effect of Y15 on the expression level of focal adhesion (FA) components in two cell lines within 2 h. Expression level of vinculin, talin, paxillin, α-actinin and zyxin within 2 h in (A) endothelial cells and (B) hepatoblastoma cells with inhibition of FAK. (C and D) Quantification of each protein expression level by image analysis of the western blot bands in (A and B). The expression level of β-actin in each group was used as an internal control, and the relative expression levels were calculated. Data are presented as means ± standard error of the mean from three independent experiments. *P<0.05 denotes statistically significant differences.
Figure 7
Figure 7
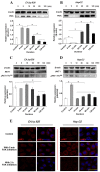
Inhibition of focal adhesion kinase (FAK) induced phosphatidylinositol 3-kinase (PI3K), AKT and phosphorylated AKT (pAKT at Thr308) in the two cell lines within 2 h. Expression level of PI3K by western blot assays and quantification of PI3K expression level by image analysis of the western blot bands within 2 h in (A) endothelial cells and (B) hepatoblastoma cells, respectively, with inhibition of FAK. The expression level of β-actin in each group was used as an internal control, and relative expression level were calculated. Expression level of pAkt by western blot assays and quantification of pAKT in total AKT (tAKT) expression by image analysis of the western blot bands in (C) endothelial cells and (D) hepatoblastoma cells. *P<0.05 denotes a statistically significant difference. (E) Immunofluorescence analysis of the effects of the distribution and expression of pAKT (red) proteins with inhibition of FAK at 5 min and 2 h (blue, DAPI-stained nuclei); scale bar, 20 µm. DAPI, 4′,6-diamidino-2-phenylindole.
Figure 8
Figure 8
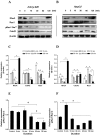
Effect of focal adhesion kinase (FAK) inhibitor on the expression level of small G-proteins-RhoA, pRac1 and Cdc42 in the two cell lines within 2 h. Expression level of RhoA, phosphorylated Rac1 (pRac1) and Cdc42 proteins with inhibition of FAK within 2 h in (A) endothelial cells and (B) hepatoblastoma cells. (C and D) Quantification of each protein expression level by image analysis of the western blot bands in (A and B). The expression level of β-actin in each group was used as an internal control, and the relative expression levels were calculated. Quantification of pRac1 in total Rac1 expression by image analysis of the western blot bands in (E) endothelial cells and (F) hepatoblastoma cells. Values are presented as the mean ± standard deviation, n=3. *P<0.05 denotes statistically significant differences compared with other groups.
Figure 9
Figure 9
Effects of the distribution and expression of Rac1 (red) and talin (green) proteins with inhibition of focal adhesion kinase (FAK) after 2 h by double-labeled immunofluorescence staining (blue, DAPI-stained nuclei); white scale bar, 20 µm. Enlarged images of the designated regions, labeled by red (EA.hy926) and yellow square (HepG2) frames to show the detailed distribution in single cells; yellow scale bar, 10 µm. DAPI, 4′,6-diamidino-2-phenylindole.

Similar articles

Cited by

References

    1. Weis SM, Cheresh DA. Tumor angiogenesis: molecular pathways and therapeutic targets. Nat Med. 2011;17:1359–1370. doi: 10.1038/nm.2537. - DOI - PubMed
    1. Lamalice L, Le Boeuf F, Huot J. Endothelial cell migration during angiogenesis. Circ Res. 2007;100:782–794. doi: 10.1161/01.RES.0000259593.07661.1e. - DOI - PubMed
    1. Friedl P, Wolf K. Tumour-cell invasion and migration: diversity and escape mechanisms. Nat Rev Cancer. 2003;3:362–374. doi: 10.1038/nrc1075. - DOI - PubMed
    1. Baker EL, Zaman MH. The biomechanical integrin. J Biomech. 2010;43:38–44. doi: 10.1016/j.jbiomech.2009.09.007. - DOI - PMC - PubMed
    1. Pasapera AM, Schneider IC, Rericha E, Schlaepfer DD, Waterman CM. Myosin II activity regulates vinculin recruitment to focal adhesions through FAK-mediated paxillin phosphorylation. J Cell Biol. 2010;188:877–890. doi: 10.1083/jcb.200906012. - DOI - PMC - PubMed