Downregulated miR-23b-3p expression acts as a predictor of hepatocellular carcinoma progression: A study based on public data and RT-qPCR verification
- PMID: 29484429
- PMCID: PMC5846654
- DOI: 10.3892/ijmm.2018.3513
Downregulated miR-23b-3p expression acts as a predictor of hepatocellular carcinoma progression: A study based on public data and RT-qPCR verification
Abstract
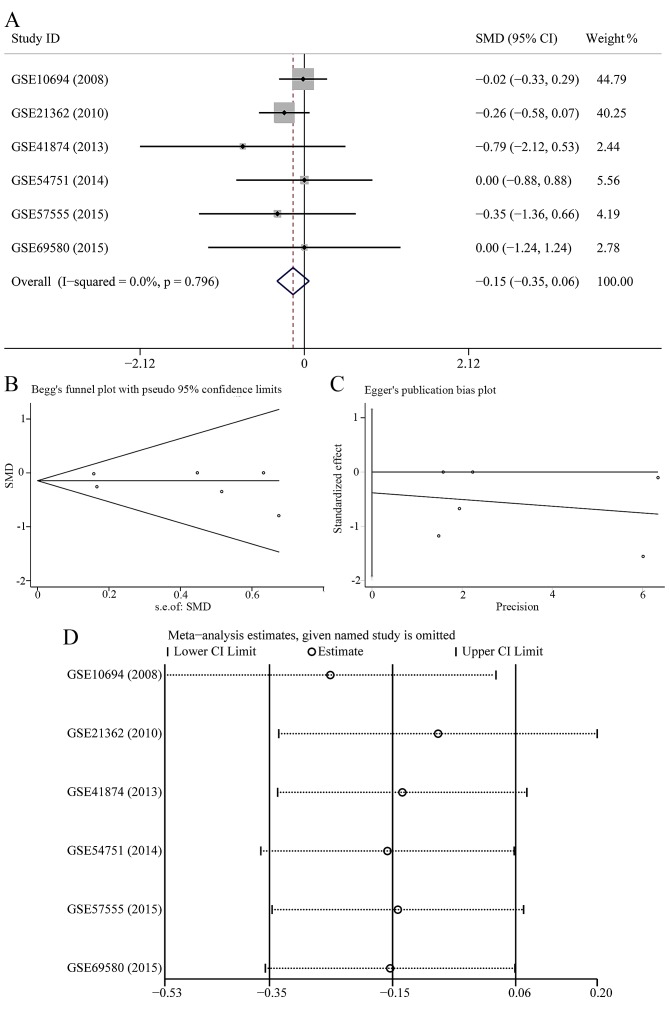
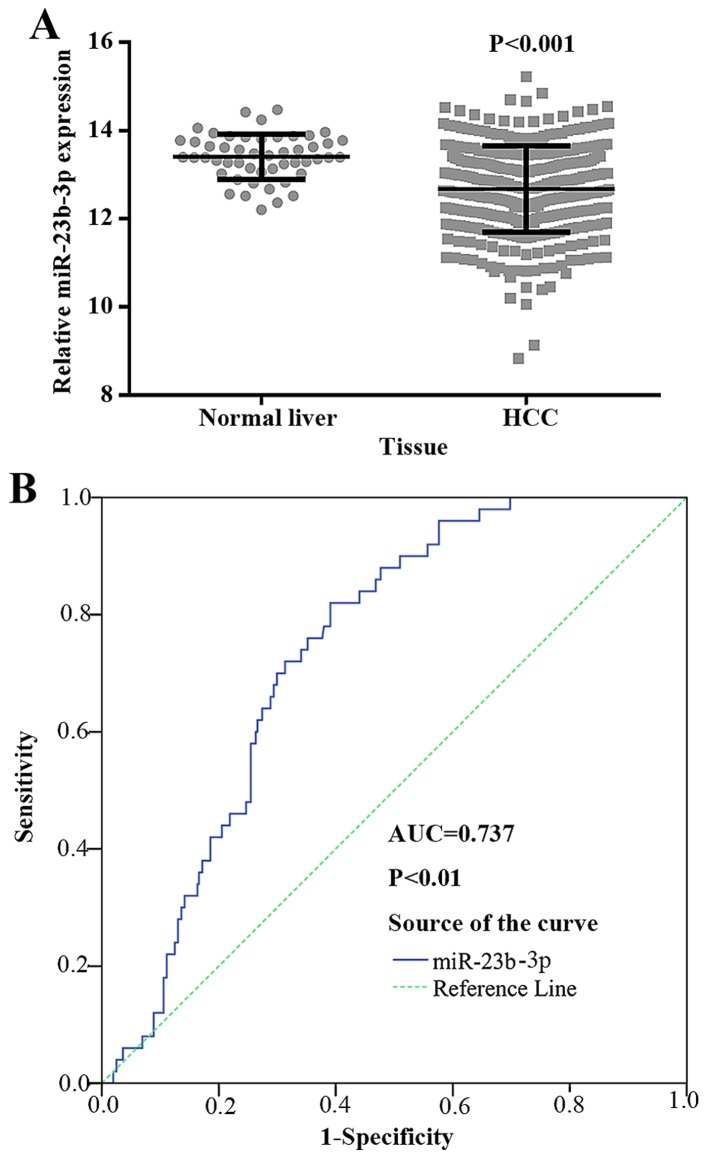
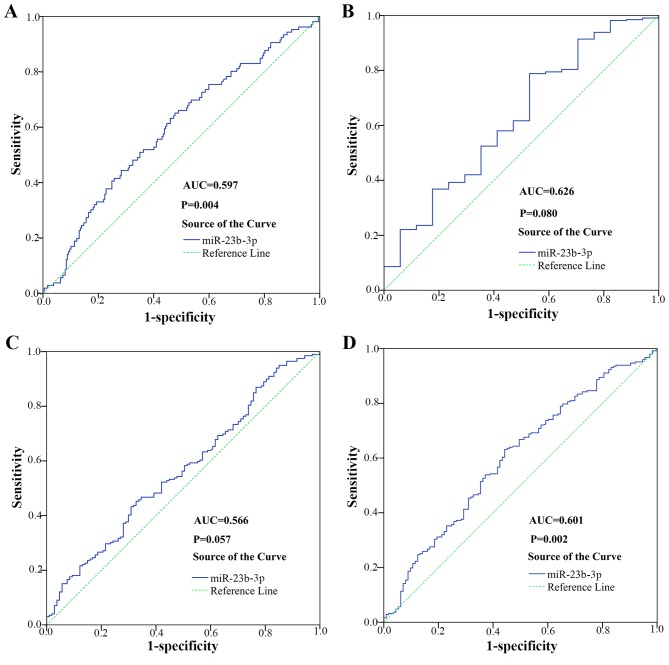
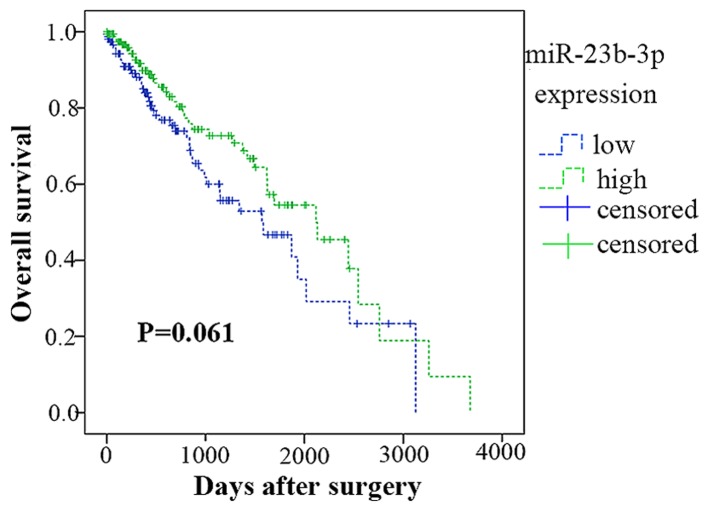
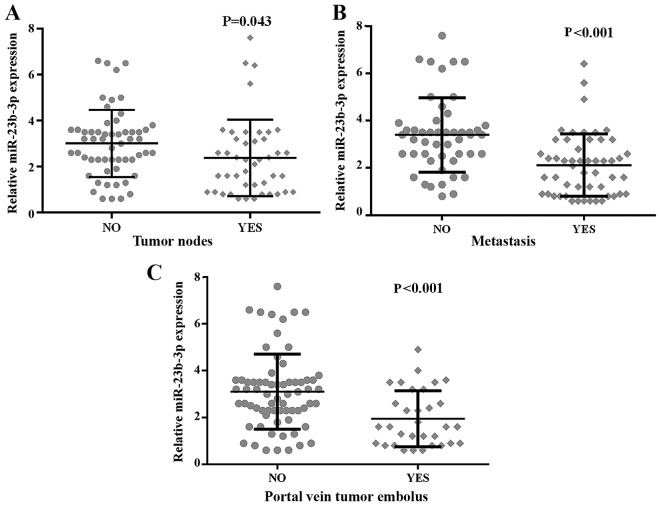
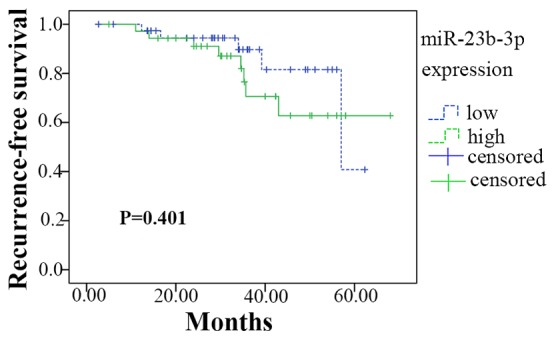
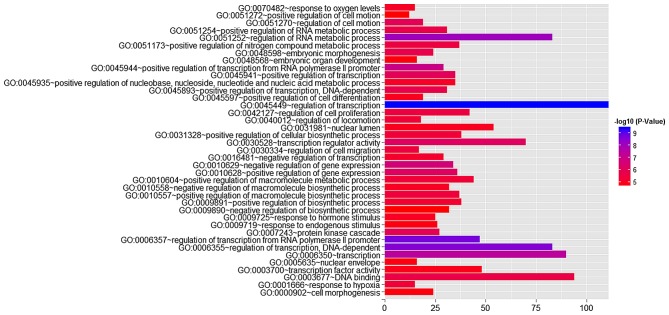
Mounting evidence has shown that miR-23b-3p, which is associated with cell proliferation, invasion, and apoptosis, acts as a biomarker for diagnosis and outcomes in numerous cancers. However, the clinicopathological implication of miR-23b-3p in hepatocellular carcinoma (HCC) remains unclear. Our study evaluated the role of miR-23b-3p in HCC and investigated its potential application as a marker for preliminary diagnosis and therapy in HCC. High-throughput data from the NCBI Gene Expression Omnibus (GEO) and The Cancer Genome Atlas (TCGA) were collected and analyzed. One hundred and one tissue sections of HCC were paired with adjacent non-cancerous HCC as further supplements. miR-23b-3p expression was detected using quantitative real-time PCR. Additionally, the relationship between miR-23b-3p expression and HCC progression and Time-to-recurrence (months) was explored. Ten algorithms were applied to predict the prospective target genes of miR-23b-3p. Next, we conducted bioinformatics analysis for further study. miR-23b-3p expression was pronouncedly decreased in HCC tissues in contrast with their paired adjacent non-cancerous HCC (P<0.001) with RT-qPCR. In total, 405 targets, acquired with consistent prediction from at least five databases, were used for the bioinformatics analysis. According to the Gene Ontology (GO) analysis, all targets were classified into biological processes, cellular components and molecular functions. In the pathway analysis, targets of miR-23b-3p were primarily enriched in the signaling pathways of renal cell carcinoma, hepatitis B and pancreatic cancer (corrected P-value <0.05). In the protein-protein interaction (PPI) network for miR-23b-3p, a total of 8 targets, including SRC, AKT1, EGFR, CTNNB1, BCL2, SMAD3, PTEN and KDM6A, were located in the key nodes with high degree (>35). In conclusion, this study provides impressive illumination of the potential role of miR-23b-3p in HCC tumorigenesis and progression. Furthermore, miR-23b-3p may act as a predictor of HCC and could be a new treatment target.
Conflict of interest statement
The authors declare that they have no competing interests.
Figures


Similar articles
-
Investigation of miR-490-3p Expression in Hepatocellular Carcinoma Based on Reverse Transcription-Polymerase Chain Reaction (RT-qPCR) and a Meta-Analysis of 749 Cases.Med Sci Monit. 2018 Jul 15;24:4914-4925. doi: 10.12659/MSM.908492. Med Sci Monit. 2018. PMID: 30007991 Free PMC article.
-
Identification of invasion-metastasis-associated microRNAs in hepatocellular carcinoma based on bioinformatic analysis and experimental validation.J Transl Med. 2018 Sep 29;16(1):266. doi: 10.1186/s12967-018-1639-8. J Transl Med. 2018. PMID: 30268144 Free PMC article.
-
Evaluation of miR-302b-5p expression and molecular mechanism in hepatocellular carcinoma: Findings based on RT-qPCR and in silico analysis.Pathol Res Pract. 2019 Jul;215(7):152424. doi: 10.1016/j.prp.2019.04.016. Epub 2019 Apr 29. Pathol Res Pract. 2019. PMID: 31103408
-
miR-23b-3p, miR-124-3p and miR-218-5p Synergistic or Additive Effects on Cellular Processes That Modulate Cervical Cancer Progression? A Molecular Balance That Needs Attention.Int J Mol Sci. 2022 Nov 4;23(21):13551. doi: 10.3390/ijms232113551. Int J Mol Sci. 2022. PMID: 36362337 Free PMC article. Review.
-
Functional Role of microRNA-23b-3p in Cancer Biology.Microrna. 2018;7(3):156-166. doi: 10.2174/2211536607666180629155025. Microrna. 2018. PMID: 29962353 Review.
Cited by
-
Comprehensive analysis of a TPX2-related TRHDE-AS1/PKIA ceRNA network involving prognostic signatures in Hepatitis B virus-infected hepatocellular carcinoma.Front Cell Infect Microbiol. 2022 Sep 20;12:1025900. doi: 10.3389/fcimb.2022.1025900. eCollection 2022. Front Cell Infect Microbiol. 2022. PMID: 36204642 Free PMC article.
-
Four potential microRNAs affect the progression of pancreatic ductal adenocarcinoma by targeting MET via the PI3K/AKT signaling pathway.Oncol Lett. 2021 Apr;21(4):326. doi: 10.3892/ol.2021.12588. Epub 2021 Feb 24. Oncol Lett. 2021. PMID: 33692858 Free PMC article.
-
SNGH16 regulates cell autophagy to promote Sorafenib Resistance through suppressing miR-23b-3p via sponging EGR1 in hepatocellular carcinoma.Cancer Med. 2020 Jun;9(12):4324-4338. doi: 10.1002/cam4.3020. Epub 2020 Apr 23. Cancer Med. 2020. PMID: 32324343 Free PMC article.
-
Identification of key genes and long non-coding RNA associated ceRNA networks in hepatocellular carcinoma.PeerJ. 2019 Nov 1;7:e8021. doi: 10.7717/peerj.8021. eCollection 2019. PeerJ. 2019. PMID: 31695969 Free PMC article.
-
RAI14 Regulated by circNFATC3/miR-23b-3p axis Facilitates Cell Growth and Invasion in Gastric Cancer.Cell Transplant. 2021 Jan-Dec;30:9636897211007055. doi: 10.1177/09636897211007055. Cell Transplant. 2021. PMID: 33840258 Free PMC article.
References
Publication types
MeSH terms
Substances
LinkOut - more resources
Full Text Sources
Other Literature Sources
Medical
Research Materials
Miscellaneous