. 2018 Jul;45(7):1155-1169.
doi: 10.1007/s00259-018-3967-6. Epub 2018 Feb 26.

PRRT genomic signature in blood for prediction of 177Lu-octreotate efficacy

Affiliations

PRRT genomic signature in blood for prediction of 177Lu-octreotate efficacy

Lisa Bodei et al. Eur J Nucl Med Mol Imaging. 2018 Jul.

Abstract

Background: Peptide receptor radionuclide therapy (PRRT) utilizes somatostatin receptor (SSR) overexpression on neuroendocrine tumors (NET) to deliver targeted radiotherapy. Intensity of uptake at imaging is considered related to efficacy but has low sensitivity. A pretreatment strategy to determine individual PRRT response remains a key unmet need. NET transcript expression in blood integrated with tumor grade provides a PRRT predictive quotient (PPQ) which stratifies PRRT "responders" from "non-responders". This study clinically validates the utility of the PPQ in NETs.

Methods: The development and validation of the PPQ was undertaken in three independent 177Lu-PRRT treated cohorts. Specificity was tested in two separate somatostatin analog-treated cohorts. Prognostic value of the marker was defined in a cohort of untreated patients. The developmental cohort included lung and gastroenteropancreatic [GEP] NETs (n = 72) from IRST Meldola, Italy. The majority were GEP (71%) and low grade (86% G1-G2). Prospective validation cohorts were from Zentralklinik Bad Berka, Germany (n = 44), and Erasmus Medical Center, Rotterdam, Netherlands (n = 42). Each cohort included predominantly well differentiated, low grade (86-95%) lung and GEP-NETs. The non-PRRT comparator cohorts included SSA cohort I, n = 28 (100% low grade, 100% GEP-NET); SSA cohort II, n = 51 (98% low grade; 76% GEP-NET); and an untreated cohort, n = 44 (64% low grade; 91% GEP-NET). Baseline evaluations included clinical information (disease status, grade, SSR) and biomarker (CgA). NET blood gene transcripts (n = 8: growth factor signaling and metabolism) were measured pre-therapy and integrated with tumor Ki67 using a logistic regression model. This provided a binary output: "predicted responder" (PPQ+); "predicted non-responder" (PPQ-). Treatment response was evaluated using RECIST criteria [Responder (stable, partial and complete response) vs Non-Responder)]. Sample measurement and analyses were blinded to study outcome. Statistical evaluation included Kaplan-Meier survival and standard test evaluation analyses.

Results: In the developmental cohort, 56% responded to PRRT. The PPQ predicted 100% of responders and 84% of non-responders (accuracy: 93%). In the two validation cohorts (response: 64-79%), the PPQ was 95% accurate (Bad Berka: PPQ + =97%, PPQ- = 93%; Rotterdam: PPQ + =94%, PPQ- = 100%). Overall, the median PFS was not reached in PPQ+ vs PPQ- (10-14 months; HR: 18-77, p < 0.0001). In the comparator cohorts, the predictor (PPQ) was 47-50% accurate for SSA-treatment and 50% as a prognostic. No differences in PFS were respectively noted (PPQ+: 10-12 months vs. PPQ-: 9-15 months).

Conclusion: The PPQ derived from circulating NET specific genes and tumor grade prior to the initiation of therapy is a highly specific predictor of the efficacy of PRRT with an accuracy of 95%.

Keywords: Biomarker; Carcinoid; Liquid biopsy; Neuroendocrine; PRRT; Prediction.


Conflict of interest statement

Conflict of interest LB and GP have received consultancy fees from Ipsen and Advanced Accelerator Applications (AAA). EPK and DJK received support from AAA outside the submitted work. MK is employed by Wren Laboratories that undertook the molecular testing. IMM is a consultant for Wren Laboratories. All others have nothing to disclose.

Figures

Fig. 1
Fig. 1
STARD diagram outlining the study. PPQ =PRRT predictive quotient; R =responder, These are biomarker “positive” patients. NR= non-responder, These are biomarker “negative” patients
Fig. 2
Fig. 2
Overview of PPQ. PCR measurement of gene expression from 1 ml of blood. Two gene clusters are evaluated: NET growth factor signaling (n = 4) and NET metabolism regulation (n = 4). Summated gene expression (n = 8) is normalized to the housekeeping gene (ALG9). Individual genes exhibit expression values ranging from 0 to 104 [17]. Summated gene PCR values (n = 8) ≥5.9 are scored “1”, otherwise “0”. Each blood sample therefore has only one possible binary score. Tissue is evaluated by histology and graded (Ki-67). Tumors are categorized as either “Low” or “High”. Low include all G1 and G2 tumors (Ki67 ≤ 20%) or typical/atypical lung NETs. Low are scored “0”, high are scored “1”. Each tumor sample can therefore only have one possible score. High comprised all grade 3 (Ki67 > 20%) tumors, including NET G3, and PDNECs (e.g. SCLC). The scored (“1 or 0”) blood and tissue scores are incorporated into a logistic regression model which has two outputs—“R ” (responder) or “NR” (non-responder). These represent the predictive quotient (PPQ) predicted responses to PRRT. An “R” value is expected to respond to therapy and an NR value is anticipated not to benefit from PRRT. AC =atypical carcinoid (bronchopulmonary NET), NR= non-responder, PDNEC =poorly differentiated neuroendocrine carcinoma, R =responder, SCLC =small cell lung cancer, TC= typical carcinoid (bronchopulmonary NET)
Fig. 3
Fig. 3
Evaluation of progression free survival in each of the three cohorts. Median progression free survival (mPFS) for Bad Berka and Meldola cohorts was 18 months. It was not reached in the Rotterdam cohort. FUP1 = initial follow-up (FUP) evaluation ~2–3 months after the last PRRT cycle. FUP2 = 2nd follow-up evaluation ~6–9 months after the last PRRT cycle
Fig. 4
Fig. 4
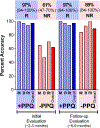
Evaluation of PPQ at two time-points: Biomarker-positive “responder” PPQ was overall 97% (range: 94–100%) accurate for predicting responders at the initial follow-up and 97% (range: 94–100%) accurate at final follow-up. Biomarker-negative PPQ was 61% (range: 47–70%) accurate for predicting non-responders at initial follow-up and 89% accurate (range: 84–100%) at final follow-up. Overall, the PPQ was 94% accurate (149/158) for predicting responders and non-responders. Initial evaluation was undertaken ~2–3 months after the last PRRT cycle. Second evaluation was undertaken ~6–9 months after the last PRRT cycle. M-Meldola Cohort, B-Bad Berka Cohort, Rt-Rotterdam Cohort
Fig. 5
Fig. 5
PRRT Prediction Quotient for PFS prediction in PRRT-treated and non-treated cohorts. PRRT cohorts: A Development Cohort: Meldola: Positive PPQ (biomarker positive) prediction pre-therapy was associated with mPFS which was not reached. A negative PPQ prediction (biomarker negative) was associated with a mPFS of 8 months. This difference was significant (HR 36.4, p <0.0001). B Validation Cohort I: Bad Berka: Positive PPQ prediction was associated with mPFS which was not reached. A negative PPQ prediction was associated with a mPFS of 14 months (HR 17.7, p <0.0001). C Validation Cohort II: Rotterdam: Positive PPQ prediction was associated with mPFS which was not reached. A negative PPQ prediction was associated with an mPFS 9.7 months. This was significantly different (HR 92, p <0.0001). No-PRRT cohorts: D Comparator Cohort I: SSA treatment: In prediction-responders, the mPFS was 10 months. For those predicted not to respond, the mPFS was 11 months. This was not significantly different (HR 0.75, p = NS). E Comparator Cohort II: SSA treatment II: In prediction-responders, the mPFS was 10 months. For those predicted not to respond, the mPFS was 15 months. This was not significantly different (HR 2.2, p = NS). F Comparator Cohort III: Watch-and-wait: In prediction-responders, the mPFS was 12 months. For those predicted not to respond, the mPFS was 9 months. This was not significantly different (HR 1.36, p = NS). PPQ-positive = biomarker-positive (responder), PPQ-negative = biomarker-negative (non-responder)
Fig.6
Fig.6
PRRT predictive quotient (PPQ) in the three PRRT cohorts for PFS prediction. A Accuracy of prediction for the PPQ and each clinical criterion. The PPQ was significantly more accurate (p < 0.0001) than any other variable measured. B The metrics of the PPQ for response were sensitivity: 97.1%, specificity: 88.9%, PPV: 94.4% and NPV: 94.1%. Dotted line represents the 80% cut-off for biomarker accuracy. PPV =positive predictive value, NPV =negative predictive value
Fig. 7
Fig. 7
Decision curve analysis. The standardized NET benefit line (y-axis) reflects the predictive usefulness of a biomarker; 1.0 reflects 100% useful, 0.5 is 50% useful; negative values reflect “harm” (negative benefit) related to an intervention based on the results of a biomarker. The x-axis demonstrates the probability (risk) of disease. When a biomarker is not used for intervention, the standardized net benefit =1.0 and the risk threshold is 0 (none). The gray line (labeled as All), reflects the overall benefit of introducing an intervention, e.g., PRRT to all individuals irrespective of biomarker value. In the treated cohort of 158 patients, the clinical benefit for the PPQ (red line) is >90% up to a disease risk threshold of 0.80. This indicates that the PPQ has significant predictive benefit for PRRT in NETs. In contrast, elevated CgA expression levels (blue line) or grade alone (green line) do not introduce any clinical benefit. Quantitatively, CgA and grade are the same as no biomarker. *p < 0.00001 vs. PPQ (Fisher’s 2-tailed exact test)
Fig. 8
Fig. 8
Clinical predictors of PRRT response. A panoply of prognostic markers has been evaluated as predictors of PRRT response. Somatostatin receptor (SSR) determination through imaging or by immunohistochemistry (IHC) function as inclusion criteria for PRRT. Their utility as a predictor of response is low. The other factors examined are all prognostic in nature and are non-predictive of PRRT response. PFS= progression free survival, ORR =objective response rate, OS= overall survival, KPS= Karnofsky Performance Status

References

    1. Modlin IM, Oberg K, Chung DC, Jensen RT, de Herder WW, Thakker RV, et al. Gastroenteropancreatic neuroendocrine tumours. Lancet Oncol. 2008;9:61–72. - PubMed
    1. Pavel M, Valle JW, Eriksson B, Rinke A, Caplin M, Chen J, et al. ENETS consensus guidelines for the standards of care in neuroendocrine neoplasms: systemic therapy - biotherapy and novel targeted agents. Neuroendocrinology. 2017;105:266–80. - PubMed
    1. Faggiano A, Lo Calzo F, Pizza G, Modica R, Colao A. The safety of available treatments options for neuroendocrine tumors. Expert Opin Drug Saf. 2017;16:1149–61. - PubMed
    1. Oberg K, Krenning E, Sundin A, Bodei L, Kidd M, Tesselaar M, et al. A Delphic consensus assessment: imaging and biomarkers in gastroenteropancreatic neuroendocrine tumor disease management. Endocrine connections. 2016;5:174–87. - PMC - PubMed
    1. Bodei L, Kwekkeboom DJ, Kidd M, Modlin IM, Krenning EP. Radiolabeled Somatostatin analogue therapy of gastroenteropancreatic cancer. Semin Nucl Med. 2016;46:225–38. - PubMed