Review
. 2018 May 15;596(10):1873-1902.
doi: 10.1113/JP275100. Epub 2018 Apr 17.

The dual-gate model for pentameric ligand-gated ion channels activation and desensitization

Affiliations
Review

The dual-gate model for pentameric ligand-gated ion channels activation and desensitization

Marc Gielen et al. J Physiol. .

Abstract

Pentameric ligand-gated ion channels (pLGICs) mediate fast neurotransmission in the nervous system. Their dysfunction is associated with psychiatric, neurological and neurodegenerative disorders such as schizophrenia, epilepsy and Alzheimer's disease. Understanding their biophysical and pharmacological properties, at both the functional and the structural level, thus holds many therapeutic promises. In addition to their agonist-elicited activation, most pLGICs display another key allosteric property, namely desensitization, in which they enter a shut state refractory to activation upon sustained agonist binding. While the activation mechanisms of several pLGICs have been revealed at near-atomic resolution, the structural foundation of desensitization has long remained elusive. Recent structural and functional data now suggest that the activation and desensitization gates are distinct, and are located at both sides of the ion channel. Such a 'dual gate mechanism' accounts for the marked allosteric effects of channel blockers, a feature illustrated herein by theoretical kinetics simulations. Comparison with other classes of ligand- and voltage-gated ion channels shows that this dual gate mechanism emerges as a common theme for the desensitization and inactivation properties of structurally unrelated ion channels.

Keywords: Allostery; Cys-loop receptors; GABA receptor; Glycine receptors; Inactivation; Nicotinic receptor; Pharmacology; Structure-function.


Figures

Figure 1
Figure 1. Structural overview and gating mechanism of pLGICs
A, left, top view of GluCl bound to glutamate (pdb code 3RIF; Hibbs & Gouaux, 2011). One subunit is highlighted in green, coordinating a glutamate molecule shown in orange at its principal face. Note the M2 helices from all five subunits, which line the ion conducting pore. Right, side view of GluCl, which delimits the extracellular domain (ECD) in the extracellular space (Ext.) and the transmembrane domain (TMD). The plasma membrane is schematized in yellow. Note the absence of the intracellular domain (ICD) in the intracellular space (Int.) for this particular construct. B, schematic depiction of pLGIC activation. For the sake of clarity, only two simplified subunits are shown, omitting the M1, M3 and M4 segments of each subunit to retain only the M2 pore‐lining segments. In this scheme, the agonist (orange oval shape) binds to its ECD interfacial orthosteric site, which elicits a pre‐activation or ‘priming’ of the receptor by promoting an unbloomed conformation of the ECD. In other words, the primed conformation displays a higher affinity for the agonist than the resting conformation. The final activation step results from the opening of the channel gate, in the upper half of the pore, potentially concomitant with the twisting of the entire receptor. Note that this scheme is oversimplified, and does not address well‐known features of pLGIC activation, such as the multiplicity of agonist binding sites, nor does it distinguish between flipping, priming or catch and hold mechanisms.
Figure 2
Figure 2. Location of molecular determinants of anionic pLGIC desensitization in the lower half of the TMD
Top left, top view of the TMD of GluCl (pdb code 3RI5; Hibbs & Gouaux, 2011). One subunit is highlighted in green, showing the arrangement of transmembrane segments M1–M4 to the pore: M4 is the most distal segment, while M2 forms the pore‐lining α helix. The other subunits are coloured in grey. Top right, enlargement showing the proximity of the M3 and M1 helices of adjacent subunits. Bottom right, side view depicting the location of the M1–M2 linker, in the vicinity of the intracellular end of the M3 helix from the adjacent subunit. Note also that the cytoplasmic M3–M4 loop extends at the C‐terminal end of M3. Bottom left, rotated side view of the M2 and M3 segments of the subunit coloured in green. The M2 9′ and −2′ residues, part of the activation gate and the selectivity filter respectively, are shown in stick representation. Their mutation affects the gating and desensitization of pLGICs (see main text). Residues highlighted with the sphere representation are homologous to the residues whose mutation strongly modulates the desensitization of α1β2 GABAARs, α1β2γ2 GABAARs and α1 GlyRs in Gielen et al. (2015). Numbering of residues has been made according to Jaiteh et al. (2016).
Figure 3
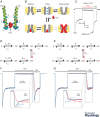
Figure 3. Picrotoxin prevents the desensitization of α1 GlyRs
A, side view of the M2 segments from GluCl (pdb code 3RI5), showing only two distal subunits for clarity. Picrotoxin (PTX) binding site is delimited by the −2′ and 2′ residues, shown in sticks. The 9′ residue position serves as a reference to pinpoint the bottom end of the activation gate. The 4′ and −3′ residues delineate the bottom of the M2–M3 interface, which bears critical determinants of the desensitization of anionic pLGICs (see main text and Fig. 2). B, depiction of a scheme in which desensitization of anionic pLGICs involves a desensitization gate overlapping the PTX binding site. Binding of PTX thus prevents the entry into the desensitized state. Moreover, PTX cannot associate to or dissociate from the resting state of the pore. This is fully consistent with previous studies, which showed that picrotoxin is trapped in the resting state of the receptor (Bali & Akabas, 2007), under the activation gate (Hibbs & Gouaux, 2011; Rossokhin & Zhorov, 2016). C, two‐electrode voltage clamp recording from an oocyte expressing α1 GlyRs. Supersaturating glycine (10 mm) elicits a current that desensitizes over a 2 min‐long application. This current can be blocked by PTX (500 μm). Co‐application of glycine and PTX for 3 min, allowing equilibration between the various allosteric states, yields a pronounced rebound current upon wash‐out of PTX. Data taken from Gielen et al. (2015). D, kinetic model corresponding to the scheme depicted in panel B. The receptor can be found in its agonist‐free resting state (R), and in agonist‐bound resting (AR), open (AO) or desensitized (AD) states. P denotes PTX‐bound states. Except for ρ, all values are taken from Gielen et al. (2015); ρ values greater than 1 reflect the stabilization of the resting state by PTX. It should be noted here that our model does not address many fine aspects of pLGIC gating: (1) Only one agonist binding site was included, whereas pLGICs usually require the binding of two or three agonist molecules for full activation (Lape et al. 2008; Corradi et al. 2009; Rayes et al. 2009; Gielen et al. 2012). No pre‐activation step is included either. Fine details of receptor activation by low concentrations of agonists (or by partial agonists) would not be recapitulated in our model. (2) Channel opening requires the binding of the agonist in our model, while it is well known that unliganded pLGICs can spontaneously open. Such spontaneous gating is, however, extremely rare at wild‐type pLGICs (Purohit & Auerbach, 2009), which is the reason why we decided not to include it. (3) Our scheme for agonist binding, activation and subsequent desensitization is linear, the agonist being thus unable to dissociate from the desensitized state in our model. This is in contradiction with what is known from desensitization recovery, and our model thus could not reflect what happens during desensitization recovery in the absence of the agonist, for example during the wash‐out of a desensitizing application of agonists. (4) Only one desensitized state is included, corresponding to a slow component of desensitization. Accounting for the detailed multiphasic components of desensitization is thus out of reach in our model. E, kinetic model, in which the PTX‐bound receptor can desensitize (ADP state). PTX is trapped in the desensitized state, akin to what happens in the resting state. Such a scheme would reflect the hypothesis that desensitization and activation might involve the same physical gate. All rates are kept identical to the ones from panel D. F, simulations performed with the kinetic model from panel D, for ρ values of 1 (grey trace), 10 (blue trace) and 100 (red trace). Note the simulations with ρ values of 1 and 10 display pronounced rebound currents akin to the one seen in experiments. Note also that further increase in ρ leads to slower apparent recovery of the current upon PTX wash‐out, and to a much reduced rebound current (see main text for discussion). Simulations were performed with QuB (Nicolai & Sachs, 2013). G, simulations performed with the kinetic model from panel E, for ρ values of 1 (grey trace), 10 (blue trace) and 100 (red trace). None of these simulations can recapitulate the pronounced experimental rebound current.
Figure 4
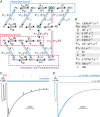
Figure 4. Interplay between ivermectin and picrotoxinin at zebrafish α1 GlyR: a plausible kinetic scheme
A, kinetic scheme proposed for the dual modulation of the zebrafish α1 GlyR, whose cryo‐EM structure was solved in Du et al. (2015). In this model, the binding of the agonist glycine (A) to the receptor (R) promotes its transition to the glycine‐bound active state (AO), which can subsequently desensitize (AD). Ivermectin (Iv) is hypothesized to stabilize the open state over the resting state, without affecting the receptor's microscopic desensitization: Iv increases the opening rate β by a factor γ, and decreases the shutting rate by a factor δ. Picrotoxinin (P) acts accordingly to Fig. 3 D: it prevents desensitization and promotes the resting state of the receptor by decreasing the opening rate of the channel by a factor ε. Note that the active states of receptors bound to glycine alone or to glycine and ivermectin are the sole ion conducting states (other states being either inactive or blocked by picrotoxinin). These two states are boxed in green. Note also that the effects of ivermectin and picrotoxinin are fully additive: when bound to both ivermectin and picrotoxinin, the channel has a microscopic opening rate of β.γ/ε, and a microscopic shutting rate given by α/δ. Such a hypothesis precludes any direct interaction between these two modulators. Finally, this kinetic model does not aim at portraying all features of GlyR functioning (see Fig. 3 D legend). B, parameters used for kinetic simulations based on the scheme from panel A. Note that these parameters were chosen arbitrarily – their exact values have not been determined for the zebrafish α1 GlyR crystallized construct. The only constraints were to satisfy a peak apparent glycine affinity of 0.26 mm, and to provide a macroscopic desensitization profile comparable to the one from Du et al. (2015). C, simulation based on the kinetic model and parameters from panels A and B. Currents elicited by 0.3 mm glycine alone are inhibited up to ∼90% by 1 mm picrotoxinin (PTX), and are potentiated approximately twofold by 5 μm ivermectin. Note that currents elicited by co‐application of glycine and ivermectin are inhibited by picrotoxinin by only ∼20%. D, simulation indicating that, with the kinetic model and parameters from panels A and B, the application of 10 mm glycine (trace in grey) elicits the same peak current and the same desensitization as the co‐application of 0.3 mm glycine and 5 μm ivermectin.
Figure 5
Figure 5. Structural rearrangements at the level of the selectivity filter and the activation gate during desensitization
A, left, side view of the M2 segments from the presumably open states (O) of GLIC (coloured red; pdb code 4HFI) and the C. elegans GluCl (coloured light pink; pdb code 3RI5), superimposed with the presumably desensitized states (D) of the human α3 GlyR (coloured blue; pdb code 5TIN) and β3 GABAAR (coloured light cyan; pdb code 4COF), showing only two distal subunits for clarity. Note the difference in the backbone conformations between the O and D structures. Middle, top view of the pore at the level of M2 −2′ residues (shown in sticks), which are part of the selectivity filter, for the structures mentioned above. Note the reduction in the pore diameter of D structures compared to O structures. Right, top view of the pore at the level of 9′ residues (shown in sticks), which are part of the activation gate, for the structures mentioned in panel A. Note the increase in the pore diameter of D structures compared to O structures, and the difference in the M2 9′ side‐chain orientations, which point towards the neighbouring M2 segments for D structures. B, left, side view of the M2 segments from the presumably open state (O) of GLIC and the presumably desensitized state (D) of the human α3 GlyR, superimposed with the structure of the α4β2 nAChR (coloured green; pdb code 5KXI). Middle, top view of the pore at the level of the selectivity filter. Note that it might be difficult to assign a functional status to the α4β2 nAChR structure on this basis, especially when taking into account potential rotamers of the nAChR −1′ glutamate (see main text). Right, top view of the pore at the level of 9′ residues (shown in sticks). Note that the conformation of the α4β2 nAChR structure superimposes well to the α3 GlyR in a putative desensitized state.
Figure 6
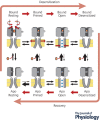
Figure 6. Proposed model for the gating and desensitization of pLGICs: a dual gate mechanism
Schematic depiction of pLGIC activation and desensitization. It expands on the iconography from Fig. 1 B to include a desensitization step, in which the intracellular end of the pore constricts during desensitization, thus forming a physical desensitization gate distinct from the activation gate.
Figure 7
Figure 7. A theoretical model: an allosteric inhibitor selectively stabilizing an agonist‐bound pre‐active state would increase the apparent affinity for the agonist
A, putative free energy diagram highlighting the effect of an allosteric inhibitor I, which would selectively stabilize the pre‐active state of a receptor (F) over its resting (R) or active (O) states in the presence of the agonist (A). Note that the free energy of the AF state is decreased by δG in the presence of I. B, translation of the free energy diagram from panel A into a linear kinetic model for the activation of the receptor by the agonist and its inhibition by I. In the presence of I, note the dependence of the pre‐activation and activation microscopic rates on the value of δG and those of δG f and δG o, the two latter reflecting the effect of the inhibitor's binding on the transition states during the AR → AF and the AO → AF transitions, respectively. C, equilibrium constants for the AR ↔ AF and AF ↔ AO equilibriums are noted as F and E, respectively. Note that the value of those constants, in the presence of the inhibitor I, depends solely on two parameters: the value of the constants in the absence of I, and the value of δG. In other words, the values of the pre‐activation and activation equilibrium constants do not depend on δG f or δG o. D, expression of the maximal peak open probability (P o,max) and of the apparent EC50 for the agonist (EC50,A) in control condition and in the presence of a saturating concentration of the inhibitor I (see Gielen et al. 2012 for further details). The binding of I causes both a decrease in the open probability, meaning that I is indeed an inhibitor, and a decrease in the apparent agonist EC50, or in other words, I increases the apparent affinity for the agonist.
Figure 8
Figure 8. The selective stabilization of a pre‐active state can recapitulate the effects of DHA on wild‐type GLIC
A, proposed kinetic model of wild‐type GLIC, expanding on Fig. 7 B and including a desensitization step to reach the agonist‐bound desensitized state AD. For the sake of simplicity, the inhibitor DHA (I) is presumed to stabilize selectively the agonist‐bound pre‐active state AF by decreasing the AF → AR (f ) and AF → AO (β) microscopic rates, although similar results would be obtained with modified f + and α rates, as long as the equilibrium constant f +/f and β/α are conserved. Note that the model probably oversimplifies many aspects of the gating of GLIC: for example, the model only contains one single binding site for protons and DHA, whereas the homomeric GLIC probably contains at least five proton binding sites, and harbours five DHA sites. Unliganded openings and proton dissociation from the desensitized state are not portrayed here, although they probably occur as for other pLGICs. B, parameters for kinetic simulations of GLIC modulation by DHA. Note that the exact values for all the microscopic steps are unknown, and were chosen arbitrarily. C, simulation of GLIC currents elicited by pH 4.5 applications, highlighting the inhibitory effect of DHA co‐application, which increases the rate and the extent of current loss upon prolonged proton applications. This could be misinterpreted in terms of an increased rate of desensitization, but only reflects the slow on‐rate of DHA association to GLIC in the kinetic model. D, theoretical concentration–response curve for DHA inhibition in simulated currents. The effect of DHA co‐application is assessed by its effect on the ratio between the steady‐state and the peak current elicited by a pH 4.5 application. With such measurement, simulations yield an apparent DHA IC50 of 9.7 μm. E, simulation of GLIC currents elicited by increasing proton concentrations (pH 7.0 to pH 3.5), either in control conditions (black trace), or in the continued presence of 50 μm DHA (red trace). F, left, normalized concentration–response curve for the proton‐elicited peak currents in control condition (continuous black line, filled black circles; pH50 = 5.0) or in the continued presence of 50 μm DHA (continuous red line, filled red triangles; pH50 = 5.2). Right, normalized concentration–response curve for the proton‐elicited steady‐state currents in control condition (dashed black line, open black circles; pH50 = 5.2) or in the continued presence of 50 μm DHA (dashed red line, open red triangles; pH50 = 5.6). Note that DHA increases the apparent affinity for protons in these simulations, 1.6‐fold and 4‐fold in the cases of peak and steady‐state responses, respectively.
Figure 9
Figure 9. The selective stabilization of a pre‐active state can recapitulate the effects of DHA on GLIC 9′ mutants
A, free energy diagram highlighting the putative effect of the M2 9′ I to A mutation on GLIC. In this model, the M2 9′ mutation selectively stabilizes the open state (AO) over the resting (AR), pre‐active (AF) and desensitized (AD) shut states (continuous black line, compared to the wild‐type in dashed grey line). Two schemes are then considered to account for the DHA inhibition: in scheme I (blue line), the inhibitor DHA selectively stabilizes the desensitized state over all other states and decreases its free energy by δG d, whereas in scheme II (red line), the inhibitor DHA selectively stabilizes the pre‐active state and decreases its free energy by δG f. In both schemes, the effects of DHA and the M2 9′ mutation are considered additive. B, left, translation of the free energy diagram from panel A into a linear kinetic model for the activation of GLIC by the agonist proton (A) and its inhibition by DHA. Right, translation of the free energy effects of the M2 9′ I to A mutation into kinetics effects, highlighting the increased efficacy of gating and the decreased equilibrium constant for desensitization. C, left, in scheme I, DHA binding displaces the AO ↔ AD equilibrium towards the AD state. In other words, the affinity of GLIC for DHA is increased in the desensitized state. Right, in scheme II, DHA affects equally the AR ↔ AF and the AF ↔ AO equilibriums, displacing them towards the AF state. In other words, the affinity of GLIC for DHA is increased in the pre‐active state. D, simulated GLIC currents elicited by pH 4.5 applications, highlighting the inhibitory effect of DHA co‐application on wild‐type GLIC (black trace) in both scheme I (left) and scheme II (right). Assuming that the M2 9′ mutation selectively stabilizes the open state, the inhibitory effect of DHA is predicted to be lost for the 9′ GLIC mutant, both in scheme I (blue trace, left) and in scheme II (red trace, right). Parameters for the simulation are identical to Fig. 8 B.
Figure 10
Figure 10. The inhibition of GLIC peak currents by pre‐applications of DHA favours an effect of DHA on the pre‐activation, rather than the desensitization, of GLIC
A, wild‐type GLIC currents simulated according to scheme I of Fig. 9, i.e. with DHA promoting desensitization. Note that DHA pre‐application fails to inhibit the peak current elicited by pH 4.5. B, wild‐type GLIC currents simulated according to scheme II of Fig. 9, i.e. with DHA selectively stabilizing the pre‐active state AF. Note that pre‐application of 10 μm and 50 μm DHA inhibit the peak current elicited by pH 4.5 by 25% and 55%, respectively. All these simulations are performed with the same parameters as in Fig. 8 B.
Figure 11
Figure 11. Independent transition of identical subunits into a unique desensitized state can result in multiphasic desensitization profiles in homomeric ligand‐gated ion channels
A, in this illustrative model of a trimeric homomeric receptor (R) gated by an agonist (A), the agonist‐bound receptor can activate (AO state), and each subunit can subsequently undergo desensitization. ADij denotes a state where subunits i and j are in their desensitized state. One major assumption of this model is that all subunits behave independently, i.e. the microscopic rates for the AO ↔ ADi and ADi ↔ ADij equilibriums are the same regardless of the identity of subunits i and j, the desensitization on‐ and off‐rates being noted d + and d , respectively. In other words, the desensitization state of one subunit does not influence the desensitization kinetics of another subunit. Finally, the pore is considered as non‐conducting, i.e. desensitized from a functional point of view, as soon as one single subunit has entered its desensitized state. As a result, only the AO state is conducting. B, arbitrary parameters chosen for the kinetic model from panel A. C, left, simulation of currents based on the model and parameters from panel A and B, elicited by a saturating 10 mm application of agonist. Middle and right, a one‐component fit (dashed blue line) does not faithfully reproduce the simulated current (continuous grey trace), unlike a two‐component fit (dashed red line). The slow component reflects the entry of receptors in states where several subunits have desensitized.
Figure 12
Figure 12. Desensitization and inactivation mechanisms across structurally unrelated families of ligand‐ and voltage‐gated ion channels
See main text for full discussion. A, schematic depiction of pLGIC activation and desensitization. For the sake of clarity, only two simplified subunits are shown, omitting the M1, M3 and M4 segments of each subunit to retain only the M2 pore‐lining segments in the transmembrane domain (TMD). Agonist binding occurs at the interface between two adjacent extracellular domains (ECD) and activation involves the opening of the pore in its upper half, while desensitization corresponds to the constriction of the desensitization gate at the level of the selectivity filter, at the intracellular end of the pore. Note the widening of the upper part of the pore during desensitization, which is probably accompanied by a rearrangement of the ECD–TMD interface. B, schematic depiction of the slow C‐type inactivation of tetrameric voltage‐gated potassium and sodium channels. For clarity, only two subunits (or repeat domains in the case of eukaryotic sodium channels) are shown, and voltage‐sensing domains are omitted. Activation is thought to open a gate at the intracellular end of the pore, while C‐type inactivation presumably involves the collapse of the P‐loop, which also forms the selectivity filter. Similar mechanisms have been suggested for the run‐down of the structurally related ATP‐ and calcium‐gated TRPM2 channel. C, schematic depiction of human P2X3 receptor activation and desensitization. Similarly to pLGICs, these trimeric ATP‐gated receptors bind their agonist at the interface between the ECDs of adjacent subunits. Activation of human P2X3 receptors involves the stretching of the pore‐lining TM2 helix, owing to a change in its helical pitch. This active state is stabilized by a cap domain. Unfolding of this cap domain presumably enables the recoiling of the TM2 segment into an α helix, thereby resulting in a desensitized state structurally distinct from the resting state at the pore level. D, schematic depiction of ionotropic glutamate receptor activation and desensitization. Here again, only two subunits are shown for clarity, out of four. The agonist binds to the interlobe cleft of the agonist binding domain (ABD) of individual subunits, which results in the closure of this clamshell‐like domain. Since the ABDs form dimers through their upper lobes, this closure results in an increased distance between the lower lobes, which are directly connected to the TMD. This movement results in the opening of the channel activation gate. Upon desensitization, the ABD dimers dissociate, which completely rearranges the ABD layer and releases the tension exerted on the pore in the active state. In this model, the TMDs of iGluRs adopt the same conformation in the resting and desensitized states. Note that this model applies to the AMPA and kainate subfamilies of fast‐desensitizing iGluRs. The desensitization of NMDA receptors might well depart from this view (see main text).

References

    1. Akabas MH (2013). Using molecular dynamics to elucidate the structural basis for function in pLGICs. Proc Natl Acad Sci USA 110, 16700–16701. - PMC - PubMed
    1. Akk G, Bracamontes J & Steinbach JH (2001). Pregnenolone sulfate block of GABAA receptors: mechanism and involvement of a residue in the M2 region of the α subunit. J Physiol 532, 673–684. - PMC - PubMed
    1. Althoff T, Hibbs RE, Banerjee S & Gouaux E (2014). X‐ray structures of GluCl in apo states reveal a gating mechanism of Cys‐loop receptors. Nature 512, 333–337. - PMC - PubMed
    1. Attwell D & Gibb A (2005). Neuroenergetics and the kinetic design of excitatory synapses. Nat Rev Neurosci 6, 841–849. - PubMed
    1. Auerbach A & Akk G (1998). Desensitization of mouse nicotinic acetylcholine receptor channels. A two‐gate mechanism. J Gen Physiol 112, 181–197. - PMC - PubMed