

Simultaneous isolation and preconcentration of exosomes by ion concentration polarization
- PMID: 29484678
- PMCID: PMC6110980
- DOI: 10.1002/elps.201700491
Simultaneous isolation and preconcentration of exosomes by ion concentration polarization
Abstract
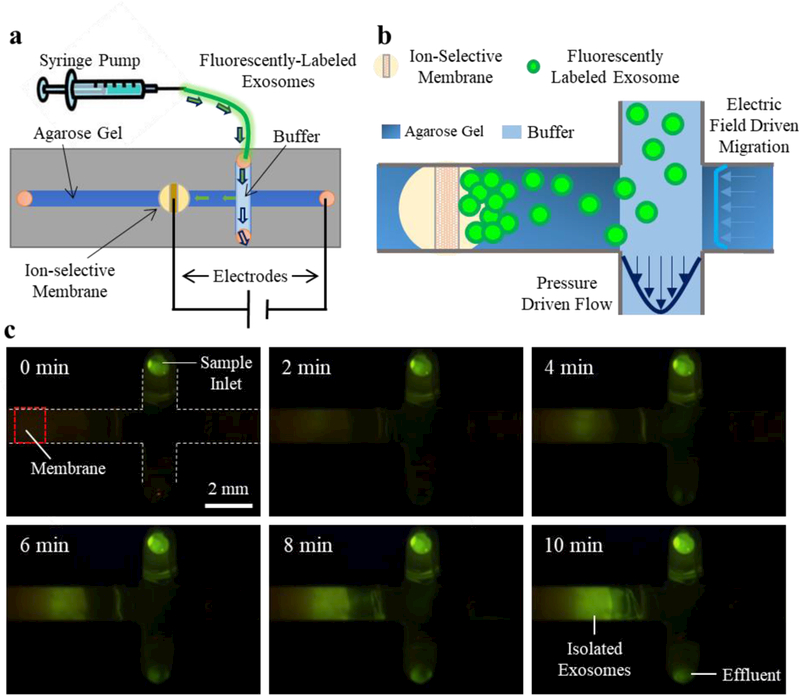
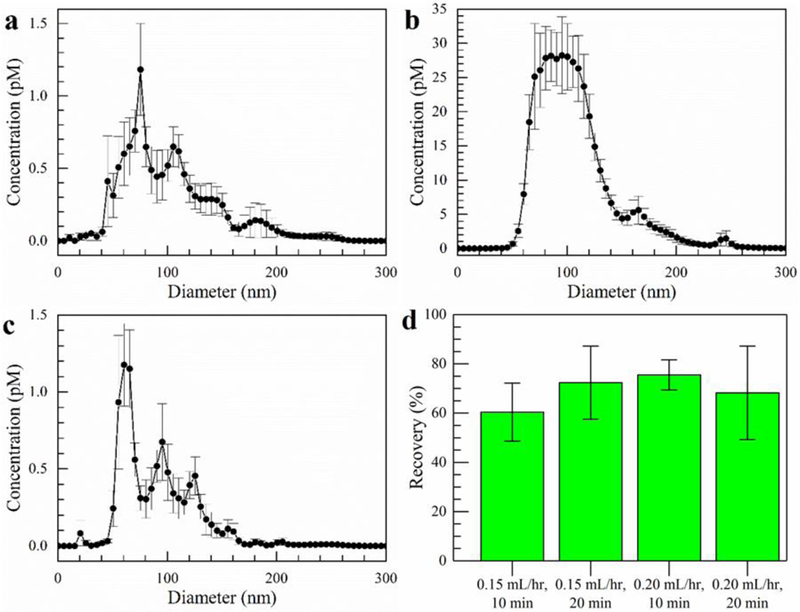
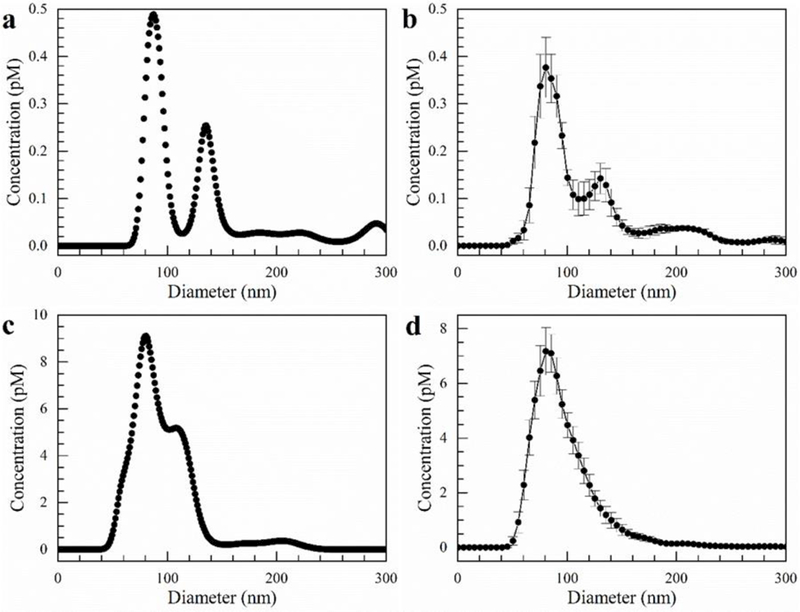
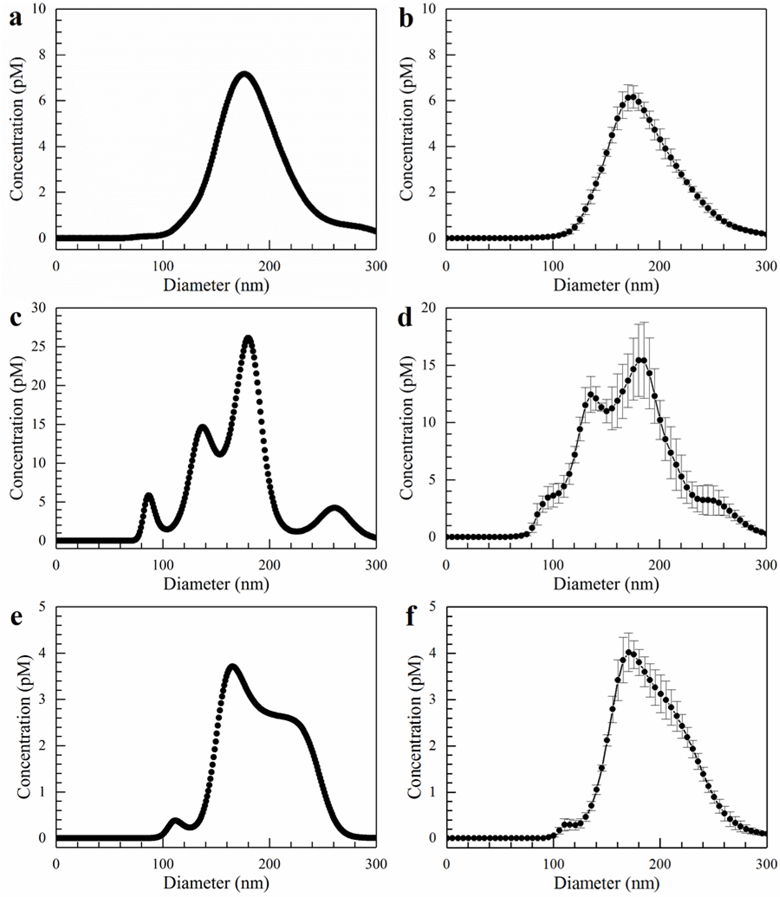
Exosomes carry microRNA biomarkers, occur in higher abundance in cancerous patients than in healthy ones, and because they are present in most biofluids, including blood and urine, these can be obtained noninvasively. Standard laboratory techniques to isolate exosomes are expensive, time consuming, provide poor purity, and recover on the order of 25% of the available exosomes. We present a new microfluidic technique to simultaneously isolate exosomes and preconcentrate them by electrophoresis using a high transverse local electric field generated by ion-depleting ion-selective membrane. We use pressure-driven flow to deliver an exosome sample to a microfluidic chip such that the transverse electric field forces them out of the cross flow and into an agarose gel which filters out unwanted cellular debris while the ion-selective membrane concentrates the exosomes through an enrichment effect. We efficiently isolated exosomes from 1× PBS buffer, cell culture media, and blood serum. Using flow rates from 150 to 200 μL/h and field strengths of 100 V/cm, we consistently captured between 60 and 80% of exosomes from buffer, cell culture media, and blood serum as confirmed by both fluorescence spectroscopy and nanoparticle tracking analysis. Our microfluidic chip maintained this recovery rate for more than 20 min with a concentration factor of 15 for 10 min of isolation.
Keywords: Exosomes; Ion concentration polarization; Microfluidics.
© 2018 WILEY-VCH Verlag GmbH & Co. KGaA, Weinheim.
Figures
References
-
- Schultz NA, Dehlendorff C, Jensen BV, Bjerregaard JK, Nielsen KR, Bojesen SE, Calatayud D, Nielsen SE, Yilmaz M, Hollander NH, Andersen KK, Johansen JS, J. Am. Med. Assoc 2014, 311, 392 – 404. - PubMed
-
- Soliman LC, Hui Y, Hewavitharana AK, Chen DDY, J. Chromatogr. A 2012, 1267, 162 – 169. - PubMed
-
- Schneider SS, Aslebagh R, Wetie A, Sturgeon S, Darie C, Arcaro K, Advancements of Mass Spectrometry in Biomedical Research 2014, 808, 399 – 408. - PubMed
Grants and funding
LinkOut - more resources
Full Text Sources
Other Literature Sources
