

Pharmacological or transcriptional inhibition of both HDAC1 and 2 leads to cell cycle blockage and apoptosis via p21Waf1/Cip1 and p19INK4d upregulation in hepatocellular carcinoma
- PMID: 29484736
- PMCID: PMC6528930
- DOI: 10.1111/cpr.12447
Pharmacological or transcriptional inhibition of both HDAC1 and 2 leads to cell cycle blockage and apoptosis via p21Waf1/Cip1 and p19INK4d upregulation in hepatocellular carcinoma
Abstract
Objectives: Histone deacetylases (HDACs) are commonly dysregulated in cancer and represent promising therapeutic targets. However, global HDAC inhibitors have shown limited efficacy in the treatment of solid tumours, including hepatocellular carcinoma (HCC). In this study, we investigated the therapeutic effect of selectively inhibiting HDAC1 and 2 in HCC.
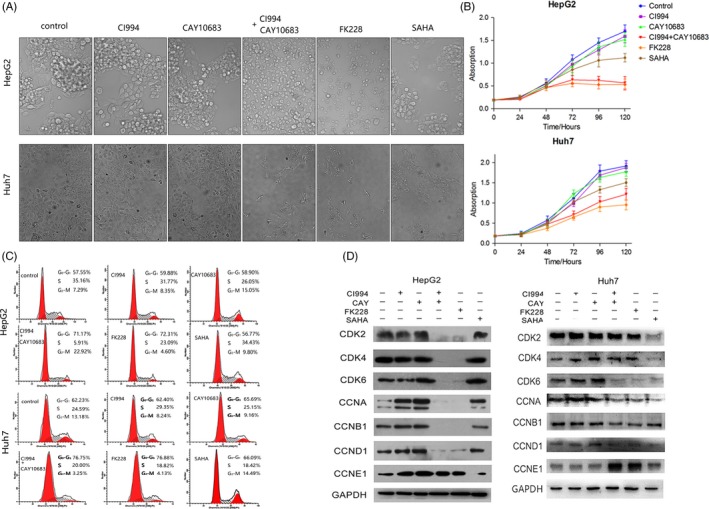
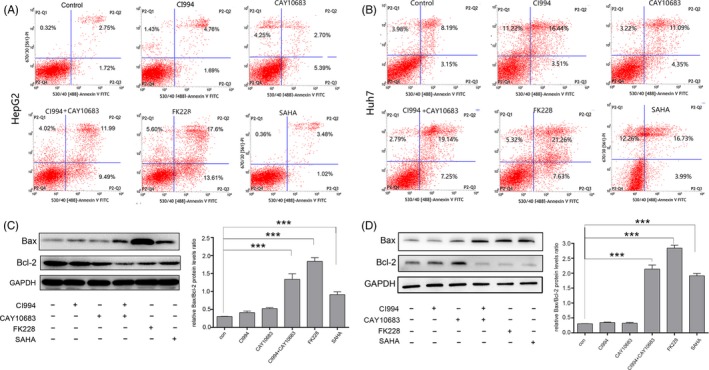
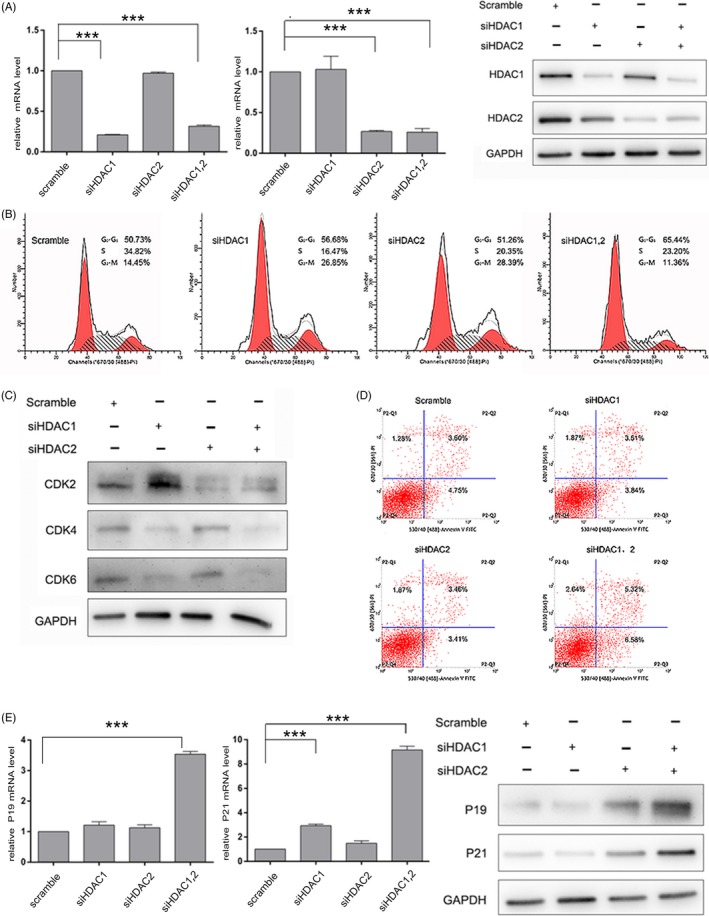
Methods: HDAC1 inhibitor Tacedinaline (CI994), HDAC2 inhibitor Santacruzamate A (CAY10683), HDAC1/2 common inhibitor Romidepsin (FK228) and global HDAC inhibitor Vorinostat (SAHA) were used to treat HCC cells. Cell cycle, apoptosis and the protein levels of CDKs and CDKNs were performed to evaluate HCC cell growth. Inhibition of HDAC1/2 by RNAi was further investigated.
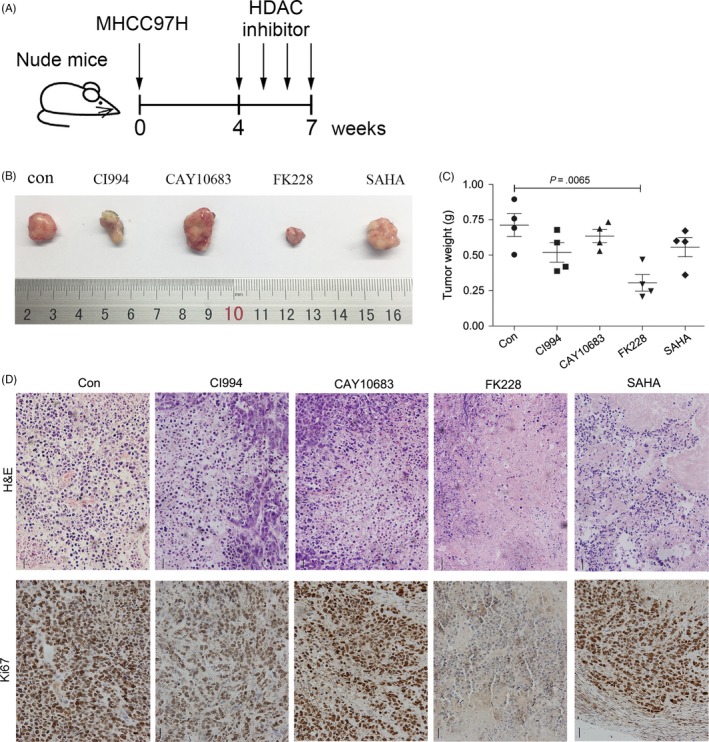
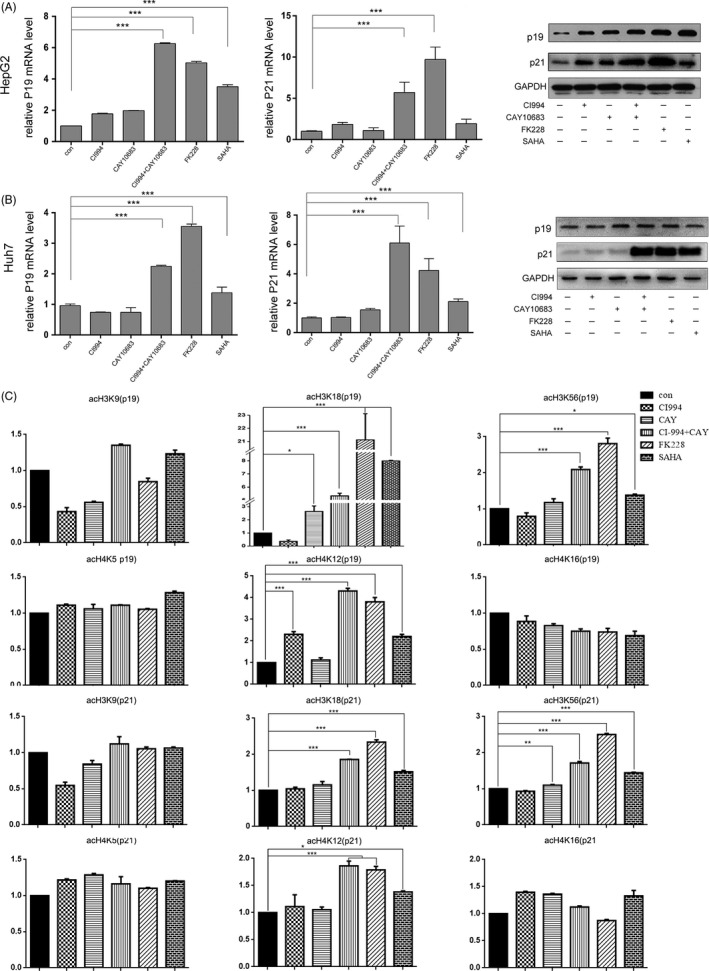
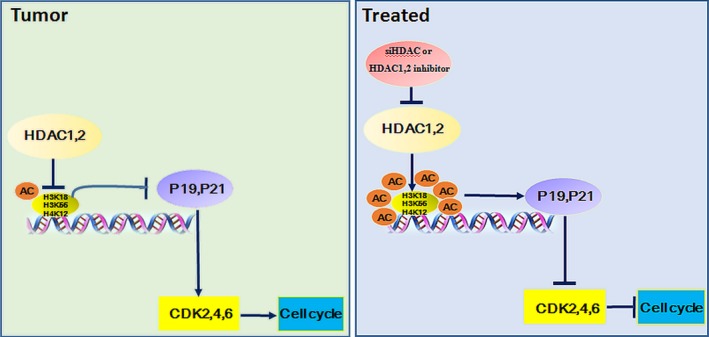
Results: Combined inhibition of HDAC1/2 led to HCC cell morphology changes, growth inhibition, cell cycle blockage and apoptosis in vitro and suppressed the growth of subcutaneous HCC xenograft tumours in vivo. p21Waf1/Cip1 and p19INK4d , which play roles in cell cycle blockage and apoptosis induction, were upregulated. Inhibition of HDAC1/2 by siRNA further demonstrated that HDAC1 and 2 cooperate in blocking the cell cycle and inducing apoptosis via p19INK4d and p21Waf1/Cip1 upregulation. Finally, H3K18, H3K56 and H4K12 in the p19INK4d and p21Waf1/Cip1 promoter regions were found to be targets of HDAC1/2.
Conclusions: Pharmacological or transcriptional inhibition of HDAC1/2 increases p19INK4d and p21Waf1/Cip1 expression, decreases CDK expression and arrests HCC growth. These results indicated a potential pharmacological mechanism of selective HDAC1/2 inhibitors in HCC therapy.
© 2018 John Wiley & Sons Ltd.
Conflict of interest statement
The authors who have taken part in this study declared that they do not have anything to disclose regarding funding or conflict of interest with respect to this manuscript.
Figures

Similar articles
-
The role of p21(waf1/cip1) and p27(Kip1) in HDACi-mediated tumor cell death and cell cycle arrest in the Eμ-myc model of B-cell lymphoma.Oncogene. 2014 Nov 20;33(47):5415-23. doi: 10.1038/onc.2013.482. Epub 2013 Dec 2. Oncogene. 2014. PMID: 24292681
-
1,25(OH)2D3 inhibits the progression of hepatocellular carcinoma via downregulating HDAC2 and upregulating P21(WAFI/CIP1).Mol Med Rep. 2016 Feb;13(2):1373-80. doi: 10.3892/mmr.2015.4676. Epub 2015 Dec 11. Mol Med Rep. 2016. PMID: 26676829
-
Histone deacetylases activate hepatocyte growth factor signaling by repressing microRNA-449 in hepatocellular carcinoma cells.Gastroenterology. 2012 Sep;143(3):811-820.e15. doi: 10.1053/j.gastro.2012.05.033. Epub 2012 May 26. Gastroenterology. 2012. PMID: 22641068
-
Histone deacetylase inhibitors: signalling towards p21cip1/waf1.Int J Biochem Cell Biol. 2007;39(7-8):1367-74. doi: 10.1016/j.biocel.2007.03.001. Epub 2007 Mar 7. Int J Biochem Cell Biol. 2007. PMID: 17412634 Review.
-
Histone deacetylase inhibitor activates the p21/WAF1/Cip1 gene promoter through the Sp1 sites.Ann N Y Acad Sci. 1999;886:195-9. doi: 10.1111/j.1749-6632.1999.tb09415.x. Ann N Y Acad Sci. 1999. PMID: 10667218 Review.
Cited by
-
The Effect of 5-Aza-2'-Deoxycytidine in Combination to and in Comparison with Vorinostat on DNA Methyltransferases, Histone Deacetylase 1, Glutathione S-Transferase 1 and Suppressor of Cytokine Signaling 1 Genes Expression, Cell Growth Inhibition and Apoptotic Induction in Hepatocellular LCL-PI 11 Cell Line.Int J Hematol Oncol Stem Cell Res. 2020 Jan 1;14(1):45-55. Int J Hematol Oncol Stem Cell Res. 2020. PMID: 32337014 Free PMC article.
-
The Therapeutic Strategy of HDAC6 Inhibitors in Lymphoproliferative Disease.Int J Mol Sci. 2018 Aug 9;19(8):2337. doi: 10.3390/ijms19082337. Int J Mol Sci. 2018. PMID: 30096875 Free PMC article. Review.
-
Marine Cyanobacteria: A Source of Lead Compounds and their Clinically-Relevant Molecular Targets.Molecules. 2020 May 8;25(9):2197. doi: 10.3390/molecules25092197. Molecules. 2020. PMID: 32397127 Free PMC article. Review.
-
Decreased proliferation of aged rat beta cells corresponds with enhanced expression of the cell cycle inhibitor p27KIP1.Biol Cell. 2021 Dec;113(12):507-521. doi: 10.1111/boc.202100035. Epub 2021 Sep 27. Biol Cell. 2021. PMID: 34523154 Free PMC article.
-
Romidepsin hepatocellular carcinoma suppression in mice is associated with deregulated gene expression of bone morphogenetic protein and Notch signaling pathway components.Mol Biol Rep. 2021 Jan;48(1):551-562. doi: 10.1007/s11033-020-06089-9. Epub 2021 Jan 3. Mol Biol Rep. 2021. PMID: 33393006
References
-
- Torre LA, Bray F, Siegel RL, Ferlay J, Lortet‐Tieulent J, Jemal A. Global cancer statistics, 2012. CA Cancer J Clin. 2015;65:87‐108. - PubMed
-
- Arzumanyan A, Reis HM, Feitelson MA. Pathogenic mechanisms in HBV‐ and HCV‐associated hepatocellular carcinoma. Nat Rev Cancer. 2013;13:123‐135. - PubMed
-
- Maluccio M, Covey A. Recent progress in understanding, diagnosing, and treating hepatocellular carcinoma. CA Cancer J Clin. 2012;62:394‐399. - PubMed
-
- Bosch FX, Ribes J, Diaz M, Cleries R. Primary liver cancer: worldwide incidence and trends. Gastroenterology. 2004;127:S5‐S16. - PubMed
MeSH terms
Substances
LinkOut - more resources
Full Text Sources
Other Literature Sources
Medical
Miscellaneous
