Review
. 2018 Aug 27;57(35):11140-11162.
doi: 10.1002/anie.201711842. Epub 2018 Aug 1.

Parahydrogen-Based Hyperpolarization for Biomedicine

Affiliations
Review

Parahydrogen-Based Hyperpolarization for Biomedicine

Jan-Bernd Hövener et al. Angew Chem Int Ed Engl. .

Abstract

Magnetic resonance (MR) is one of the most versatile and useful physical effects used for human imaging, chemical analysis, and the elucidation of molecular structures. However, its full potential is rarely used, because only a small fraction of the nuclear spin ensemble is polarized, that is, aligned with the applied static magnetic field. Hyperpolarization methods seek other means to increase the polarization and thus the MR signal. A unique source of pure spin order is the entangled singlet spin state of dihydrogen, parahydrogen (pH2 ), which is inherently stable and long-lived. When brought into contact with another molecule, this "spin order on demand" allows the MR signal to be enhanced by several orders of magnitude. Considerable progress has been made in the past decade in the area of pH2 -based hyperpolarization techniques for biomedical applications. It is the goal of this Review to provide a selective overview of these developments, covering the areas of spin physics, catalysis, instrumentation, preparation of the contrast agents, and applications.

Keywords: NMR spectroscopy; hyperpolarization; magnetic resonance imaging; parahydrogen.


Figures

Figure 1
Figure 1. Classification of PHIP variants according to the number of hydrogens (N) transferred from the same pH2 molecule to the substrate
N=0: SABRE=signal amplification by reversible exchange,[11] PRC=pairwise replacement catalysis.[12] N=1: oneH=one Hydrogen PHIP,[13] N=2: PASADENA=parahydrogen and synthesis allow dramatically enhanced nuclear alignment,[2a, 2b] ALTADENA=adiabatic longitudinal transport after dissociation engenders net alignment.[2c] Other hyperpolarization methods: DNP=dynamic nuclear polarization, SEOP=spin exchange optical pumping,[14] Brute Force = thermal equilibration at high B0/T.
Figure 2
Figure 2
Recent examples of PASADENA and ALTADENA spectra.[27] (A) Reaction scheme and 1H-NMR spectra of acetate which was formed in methanol-d4 by pairwise addition of pH2 at high field using Pt, Pt3Sn, or PtSn intermetallic nanoparticle catalysts with different pairwise selectivity. The typical antiphase multiplets were observed (a, b). (B) Reaction scheme and 1H-NMR spectra of 2-hydroxyethyl propionate in D2O after pairwise addition of pH2 at low field. Note the enhanced signals that indicate net alignment (c, d). The figure 2B is reproduced with permission from Ref. # [27] John Wiley & Sons, Ltd., 2017.
Figure 3
Figure 3
A) Schematic view of polarization transfer from parahydrogen protons to heteronuclei by magnetic field cycling (MFC). In MFC, the magnetic field (B0) is dropped quickly from the Earth’s magnetic field (I, ca. 50 μT) to nearly zero field (II, ca. 50 nT) and slowly increased again to Earth field or higher (III), where the passages are indicated by dotted lines. From the differences in heteronuclear Larmor frequencies ΔνA–X, reported for Earth’s field and “zero” field, it can be seen that isotropic mixing between 1H and 13C can be obtained at nearly zero field (II), but is lost at earth’s field (I and III). B) Spin states of an AA′X system and respective populations, during MFC. S, T, α, β represent singlet, triplet, up and down states, respectively.[28] Upon hydrogenation with pH2 (I), the combined states Sα and Sβ are populated most (thick bars). Sα mixes with T0α, and Sβ with T0β. Arrows indicate 13C transitions, note that antiphase 13C signals are obtained at point I. After dropping to zero field (II), the states Sα, T0α, ααβ (blue) and Sβ, T0β, ββα (red) mix (isotropic mixing between 1H and 13C), and the populations marked with asterisks are inverted in the fast passage. Throughout the adiabatic remagnetization, these populations are maintained, and observable X-nucleus magnetization is obtained (III, dashed arrows).
Figure 4
Figure 4
Schematic view of the SABRE reaction and the hyperpolarization process, where pH2 and substrate (S) exchange reversibly with a polarization transfer complex (PTC). When substrate and pH2 are coordinated at the PTC, spin order is transferred to the substrate via electron mediated J-couplings. After that, the substrate dissociates while maintaining the polarization, resulting in a continuous hyperpolarization build-up on the free substrate in solution. Typically, the metal (M) is Iridium, L1 often IMes (1,3-bis(2,4,6-trimethylphenyl)-imidazolium), L2 and L3 additional substrate molecules or auxiliary ligands. Note the spin arrows are diagonal on pH2 to denote the singlet state (which is NMR invisible), and the vertical arrow in substrate (S) denotes NMR observable Z-magnetization.
Figure 5
Figure 5
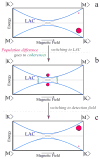
Schematic view of the polarization transfer at energy level anticrossings (LAC): Initially, only the state |K> is populated (large red circle) e.g. by addition pf pH2 to the PTC (Figure 4) and the system is at a distance from an LAC (a); next, the field is dropped so that the energy levels of |K> and another, coupled state |M> would cross if there weren’t a mutual coupling. Because of this coupling, the crossing is avoided, and coherent population transfer occurs between |K> and |M> (b); after a suitable time at the LAC, which depends on the energy difference between both states, the field is increased again, resulting in increased population of |M>, usually hyperpolarization (c).
Figure 6
Figure 6
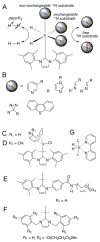
A) Schematic representation of a modern catalytic system for SABRE hyperpolarization showing an example of 15N hyperpolarization. B) List of several classes of 15N containing molecules amenable to SABRE. C) “Gold Standard” SABRE precatalyst and water soluble variant (D) using diene modifications.[95a] E) First generation of the modified ylidene ligand to improve the HP performance in water.[95a] F) Latest generation of water-soluble ylidene ligands for efficient SABRE HP in water.[39g, 95b] G) An example of chemical Ir complex chelation.[96]
Figure 7
Figure 7
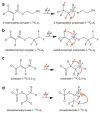
pH2 contrast agents that were used for 13C-MRI in vivo. The diagrams show the precursors (left) and final 13C HP agents that are produced by pairwise addition of pH2. Typically, the pH2-spin order is transformed to 13C-HP after the addition by means of a pulse sequence or magnetic field cycling using J-couplings (red bold arrows). a) conversion of 2-hydroxyethyl acrylate-[1-13C]-2,3,3-d3 into 13C HP 2-hydroxyethyl propionate-[1-13C]-d3; b) conversion of 2,2,3,3-tetraflloropropyl acrylate-[1-13C]-2,3,3-d3 into 13C HP 2,2,3,3-tetraflloropropyl propionate-[1-13C]-2,3,3-d3; conversion of fumarate-[1-13C]-2,3-d2 into 13C HP succinate-[1-13C]-2,3-d2; conversion of phosphoenolpyruvate-[1-13C]-3,3-d2 into phospholactate-[1-13C]-3,3-d2.
Figure 8
Figure 8
1H MRI (gray) of a rat bearing a RENCA (left) or Lymphoma A20 tumor (right), and superimposed 13C-MRI acquired after the injection of 13C HP DES (false color). The location of the tumors are indicated by the yellow box.[114]
Figure 9
Figure 9
Production, injection and imaging of HP PLAC. pH2 is produced (left) and employed in the PHIP polarizer to HP phospholactate-1-13C-d2 (PLAC) to >10%.[6b] This mCA is then injected in a mouse, where it becomes HP lactate-1-13C-d2 within seconds after injection[102c] and can be imaged using slice selective 2D 13C MRI.[60b]
Figure 10
Figure 10
A) Molecular diagram of imidazole-15N2 protonation (due to fast proton hopping between two 15N sites, both sites have the same 15N chemical shift); B) 15N chemical shifts of imidazole-15N2 as function of pH in aqueous solution. C) Selected 15N spectra of 15N-HP imidazole in water used for pKa determination. Reprinted with permission from Shchepin, R. V.; et al. ACS Sensors 2016, 1, 640–644.[39i]

References

    1. Goodson BM, Whiting N, Coffey AM, Nikolaou P, Shi F, Gust BM, Gemeinhardt ME, Shchepin RV, Skinner JG, Birchall JR, Barlow MJ, Chekmenev EY. Emagres. 2015;4:797–810.
    2. Nikolaou P, Goodson BM, Chekmenev EY. Chem Eur J. 2015;21:3156–3166. - PMC - PubMed
    1. Bowers CR, Weitekamp DP. Phys Rev Lett. 1986;57:2645–2648. - PubMed
    2. Bowers CR, Weitekamp DP. J Am Chem Soc. 1987;109:5541–5542.
    3. Pravica MG, Weitekamp DP. Chem Phys Lett. 1988;145:255–258.
    1. Eisenschmid TC, Kirss RU, Deutsch PP, Hommeltoft SI, Eisenberg R, Bargon J, Lawler RG, Balch AL. J Am Chem Soc. 1987;109:8089–8091.
    1. Shchepin RV, Barskiy DA, Coffey AM, Manzanera Esteve IV, Chekmenev EY. Angew Chem Int Ed. 2016;55:6071–6074. - PMC - PubMed
    2. McCormick J, Grunfeld AM, Ertas YN, Biswas AN, Marsh KL, Wagner S, Glöggler S, Bouchard LS. Anal Chem. 2017;89:7190–7194. - PubMed
    1. Reineri F, Boi T, Aime S. Nat Commun. 2015;6:5858. - PubMed

Publication types