

Elevated GLUT4 and glycogenin protein abundance correspond to increased glycogen content in the soleus muscle of mdx mice with no benefit associated with taurine supplementation
- PMID: 29484837
- PMCID: PMC5827563
- DOI: 10.14814/phy2.13596
Elevated GLUT4 and glycogenin protein abundance correspond to increased glycogen content in the soleus muscle of mdx mice with no benefit associated with taurine supplementation
Abstract
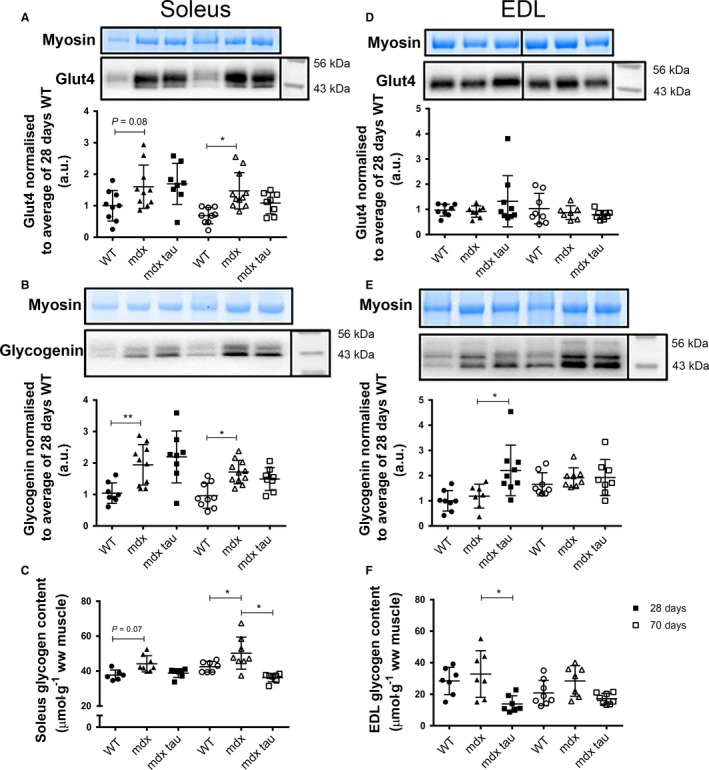
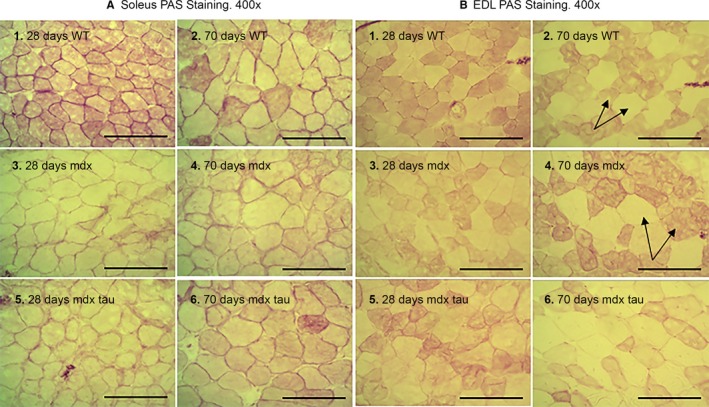
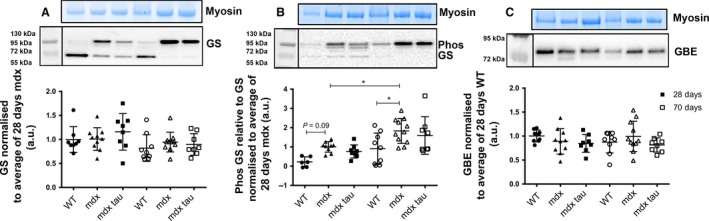
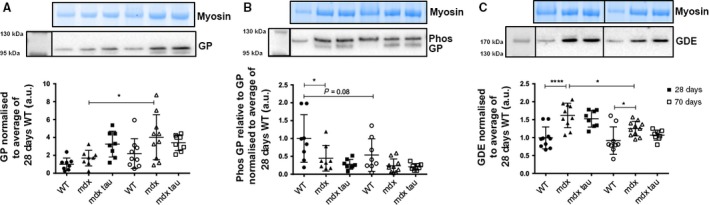
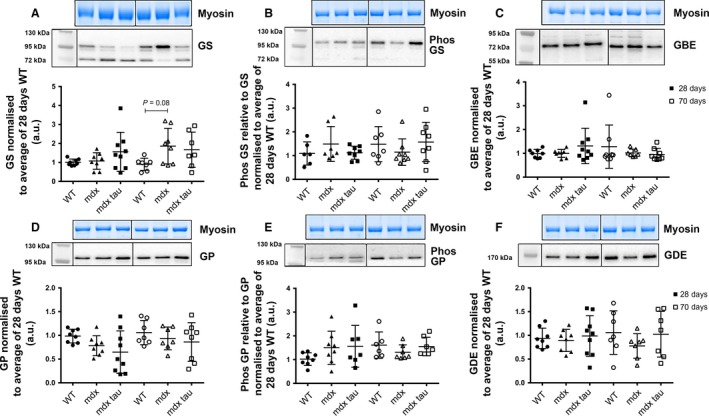
Duchenne muscular dystrophy (DMD) patients and the dystrophic mdx mouse have an elevated demand for ATP requiring processes, including Ca2+ regulation and skeletal muscle regeneration. As a key substrate for cellular ATP production, altered glycogen metabolism may contribute significantly to dystrophic pathology and explain reports of mild glucose intolerance. We compare the soleus and extensor digitorum longus (EDL) muscles of the mdx mouse during active muscle necrosis (at 28 days) and at 70 days where pathology is stable. We further investigate the impact of taurine (tau) on dystrophic glycogen metabolism to identify if the benefit seen with tau in a previous study (Barker et al. ) was in part owed to altered glycogen handling. The soleus muscle of 28- and 70-day-old mdx mice had elevated glucose transporter type 4 (GLUT4), glycogenin protein abundances and glycogen content compared to WT (C57BL10/ScSn) controls. Mdx tau mice exhibited modestly reduced glycogen compared to their respective mdx group. The EDL muscle of 28 days mdx tau mice had a ~70% increase in glycogenin protein abundance compared to the mdx but 50% less glycogen content. A twofold greater phosphorylated glycogen synthase (p-GS) and glycogen phosphorylase (p-GP) protein abundance was observed in the 70-day-old mdx soleus muscle than in the 28-day-old mdx soleus muscle. Glycogen debranching enzyme (GDE) protein abundance was elevated in both 28- and 70-day-old mdx soleus muscles compared to WT controls. We identified an increase in proteins associated with glucose uptake and utilization specific to the predominantly slow-twitch soleus muscle of mdx mice regardless of age and that taurine affords no obvious benefit to glycogen metabolism in the mdx mouse.
Keywords: Duchenne muscular dystrophy; glycogen; mdx mouse; metabolism; skeletal muscle; taurine.
© 2018 The Authors. Physiological Reports published by Wiley Periodicals, Inc. on behalf of The Physiological Society and the American Physiological Society.
Figures
Similar articles
-
Mitochondrial content is preserved throughout disease progression in the mdx mouse model of Duchenne muscular dystrophy, regardless of taurine supplementation.Am J Physiol Cell Physiol. 2018 Apr 1;314(4):C483-C491. doi: 10.1152/ajpcell.00046.2017. Epub 2017 Dec 20. Am J Physiol Cell Physiol. 2018. PMID: 29351413
-
Comparative proteomic profiling of soleus, extensor digitorum longus, flexor digitorum brevis and interosseus muscles from the mdx mouse model of Duchenne muscular dystrophy.Int J Mol Med. 2013 Sep;32(3):544-56. doi: 10.3892/ijmm.2013.1429. Epub 2013 Jul 3. Int J Mol Med. 2013. PMID: 23828267 Free PMC article.
-
A long-term treatment with taurine prevents cardiac dysfunction in mdx mice.Transl Res. 2019 Feb;204:82-99. doi: 10.1016/j.trsl.2018.09.004. Epub 2018 Sep 28. Transl Res. 2019. PMID: 30347179
-
Getting a handle on glycogen synthase - Its interaction with glycogenin.Mol Aspects Med. 2015 Dec;46:63-9. doi: 10.1016/j.mam.2015.08.004. Epub 2015 Aug 13. Mol Aspects Med. 2015. PMID: 26278983 Free PMC article. Review.
-
Bill Whelan's impact on my life and career.Mol Aspects Med. 2015 Dec;46:11-3. doi: 10.1016/j.mam.2015.08.001. Epub 2015 Aug 11. Mol Aspects Med. 2015. PMID: 26275344 Review.
References
-
- Austin, L. , de Niese M., McGregor A., Arthur H., Gurusinghe A., and Gould M. K.. 1992. Potential oxyradical damage and energy status in individual muscle fibres from degenerating muscle diseases. Neuromuscul. Disord. 2:27–33. - PubMed
-
- Barker, R. G. , Horvath D., van der Poel C., and Murphy R. M.. 2017. Benefits of prenatal taurine supplementation in preventing the onset of acute damage in the Mdx mouse. PLoS Curr. 9: https://doi.org/10.1371/currents.md.9a3e357a0154d01050b591601cbd4fdb.ecu.... - DOI - PMC - PubMed
-
- Bouskila, M. , Hunter R. W., Ibrahim A. F., Delattre L., Peggie M., van Diepen J. A., et al. 2010. Allosteric regulation of glycogen synthase controls glycogen synthesis in muscle. Cell Metab. 12:456–466. - PubMed
-
- Bushby, K. , Finkel R., Birnkrant D. J., Case L. E., Clemens P. R., Cripe L., et al. 2010. Diagnosis and management of Duchenne muscular dystrophy, part 1: diagnosis, and pharmacological and psychosocial management. Lancet Neurol. 9:77–93. - PubMed
MeSH terms
Substances
LinkOut - more resources
Full Text Sources
Other Literature Sources
Research Materials
Miscellaneous
