Evaluating the in vivo glial response to miniaturized parylene cortical probes coated with an ultra-fast degrading polymer to aid insertion
- PMID: 29485103
- PMCID: PMC7381127
- DOI: 10.1088/1741-2552/aa9fad
Evaluating the in vivo glial response to miniaturized parylene cortical probes coated with an ultra-fast degrading polymer to aid insertion
Abstract
Objective: Despite the feasibility of short-term neural recordings using implantable microelectrodes, attaining reliable, chronic recordings remains a challenge. Most neural recording devices suffer from a long-term tissue response, including gliosis, at the device-tissue interface. It was hypothesized that smaller, more flexible intracortical probes would limit gliosis by providing a better mechanical match with surrounding tissue.
Approach: This paper describes the in vivo evaluation of flexible parylene microprobes designed to improve the interface with the adjacent neural tissue to limit gliosis and thereby allow for improved recording longevity. The probes were coated with an ultrafast degrading tyrosine-derived polycarbonate (E5005(2K)) polymer that provides temporary mechanical support for device implantation, yet degrades within 2 h post-implantation. A parametric study of probes of varying dimensions and polymer coating thicknesses were implanted in rat brains. The glial tissue response and neuronal loss were assessed from 72 h to 24 weeks post-implantation via immunohistochemistry.
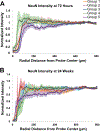
Main results: Experimental results suggest that both probe and polymer coating sizes affect the extent of gliosis. When an appropriate sized coating dimension (100 µm × 100 µm) and small probe (30 µm × 5 µm) was implanted, a minimal post-implantation glial response was observed. No discernible gliosis was detected when compared to tissue where a sham control consisting of a solid degradable polymer shuttle of the same dimensions was inserted. A larger polymer coating (200 µm × 200 µm) device induced a more severe glial response at later time points, suggesting that the initial insertion trauma can affect gliosis even when the polymer shuttle degrades rapidly. A larger degree of gliosis was also observed when comparing a larger sized probe (80 µm × 5 µm) to a smaller probe (30 µm × 5 µm) using the same polymer coating size (100 µm × 100 µm). There was no significant neuronal loss around the implantation sites for most device candidates except the group with largest polymer coating and probe sizes.
Significance: These results suggest that: (1) the degree of mechanical trauma at device implantation and mechanical mismatches at the probe-tissue interface affect long term gliosis; (2) smaller, more flexible probes may minimize the glial response to provide improved tissue biocompatibility when used for chronic neural signal recording; and (3) some degree of glial scarring did not significantly affect neuronal distribution around the probe.
Figures


Similar articles
-
Coating flexible probes with an ultra fast degrading polymer to aid in tissue insertion.Biomed Microdevices. 2015 Apr;17(2):34. doi: 10.1007/s10544-015-9927-z. Biomed Microdevices. 2015. PMID: 25681971 Free PMC article.
-
Long-term stability of intracortical recordings using perforated and arrayed Parylene sheath electrodes.J Neural Eng. 2016 Dec;13(6):066020. doi: 10.1088/1741-2560/13/6/066020. Epub 2016 Nov 7. J Neural Eng. 2016. PMID: 27819256
-
Nanoscale laminin coating modulates cortical scarring response around implanted silicon microelectrode arrays.J Neural Eng. 2006 Dec;3(4):316-26. doi: 10.1088/1741-2560/3/4/009. Epub 2006 Nov 15. J Neural Eng. 2006. PMID: 17124336
-
A review on mechanical considerations for chronically-implanted neural probes.J Neural Eng. 2018 Jun;15(3):031001. doi: 10.1088/1741-2552/aa8b4f. Epub 2017 Sep 8. J Neural Eng. 2018. PMID: 28885187 Review.
-
A comparison of insertion methods for surgical placement of penetrating neural interfaces.J Neural Eng. 2021 Apr 26;18(4):10.1088/1741-2552/abf6f2. doi: 10.1088/1741-2552/abf6f2. J Neural Eng. 2021. PMID: 33845469 Free PMC article. Review.
Cited by
-
Intracortical Microelectrode Array Unit Yield under Chronic Conditions: A Comparative Evaluation.Micromachines (Basel). 2021 Aug 17;12(8):972. doi: 10.3390/mi12080972. Micromachines (Basel). 2021. PMID: 34442594 Free PMC article. Review.
-
More Than Cell Markers: Understanding Heterogeneous Glial Responses to Implantable Neural Devices.Front Cell Neurosci. 2021 Apr 12;15:658992. doi: 10.3389/fncel.2021.658992. eCollection 2021. Front Cell Neurosci. 2021. PMID: 33912015 Free PMC article. No abstract available.
-
Beyond Tissue replacement: The Emerging role of smart implants in healthcare.Mater Today Bio. 2023 Aug 29;22:100784. doi: 10.1016/j.mtbio.2023.100784. eCollection 2023 Oct. Mater Today Bio. 2023. PMID: 37731959 Free PMC article. Review.
-
Flexible and Stretchable Bio-Integrated Electronics Based on Carbon Nanotube and Graphene.Materials (Basel). 2018 Jul 8;11(7):1163. doi: 10.3390/ma11071163. Materials (Basel). 2018. PMID: 29986539 Free PMC article. Review.
-
A Critical Review of Microelectrode Arrays and Strategies for Improving Neural Interfaces.Adv Healthc Mater. 2019 Oct;8(19):e1900558. doi: 10.1002/adhm.201900558. Epub 2019 Aug 28. Adv Healthc Mater. 2019. PMID: 31464094 Free PMC article. Review.
References
-
- Schwartz AB, Cui XT, Weber DJ and Moran DW 2006. Brain-controlled interfaces: movement restoration with neural prosthetics Neuron 52 205–20 - PubMed
-
- Daly JJ and Wolpaw JR 2008. Brain-computer interfaces in neurological rehabilitation Lancet. Neurol 7 1032–43 - PubMed
-
- Gunasekera B, Saxena T, Bellamkonda R and Karumbaiah L 2015. Intracortical recording interfaces: current challenges to chronic recording function ACS Chem. Neurosci 6 68–83 - PubMed
Publication types
MeSH terms
Substances
Grants and funding
LinkOut - more resources
Full Text Sources
Other Literature Sources
