Colorectal Cancer: Cost-effectiveness of Colonoscopy versus CT Colonography Screening with Participation Rates and Costs
- PMID: 29485322
- PMCID: PMC6716164
- DOI: 10.1148/radiol.2017162359
Colorectal Cancer: Cost-effectiveness of Colonoscopy versus CT Colonography Screening with Participation Rates and Costs
Abstract
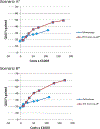
Purpose To compare the cost-effectiveness of computed tomographic (CT) colonography and colonoscopy screening by using data on unit costs and participation rates from a randomized controlled screening trial in a dedicated screening setting. Materials and Methods Observed participation rates and screening costs from the Colonoscopy or Colonography for Screening, or COCOS, trial were used in a microsimulation model to estimate costs and quality-adjusted life-years (QALYs) gained with colonoscopy and CT colonography screening. For both tests, the authors determined optimal age range and screening interval combinations assuming a 100% participation rate. Assuming observed participation for these combinations, the cost-effectiveness of both tests was compared. Extracolonic findings were not included because long-term follow-up data are lacking. Results The participation rates for colonoscopy and CT colonography were 21.5% (1276 of 5924 invitees) and 33.6% (982 of 2920 invitees), respectively. Colonoscopy was more cost-effective in the screening strategies with one or two lifetime screenings, whereas CT colonography was more cost-effective in strategies with more lifetime screenings. CT colonography was the preferred test for willingness-to-pay-thresholds of €3200 per QALY gained and higher, which is lower than the Dutch willingness-to-pay threshold of €20 000. With equal participation, colonoscopy was the preferred test independent of willingness-to-pay thresholds. The findings were robust for most of the sensitivity analyses, except with regard to relative screening costs and subsequent participation. Conclusion Because of the higher participation rates, CT colonography screening for colorectal cancer is more cost-effective than colonoscopy screening. The implementation of CT colonography screening requires previous satisfactory resolution to the question as to how best to deal with extracolonic findings. © RSNA, 2018 Online supplemental material is available for this article.
Conflict of interest statement
COMPETING INTERESTS
No conflicts of interest exist for all authors listed.
Figures


References
-
- Jemal A, Bray F, Center MM, Ferlay J, Ward E, Forman D. Global cancer statistics. CA Cancer J Clin. 2011;61(2):69–90. - PubMed
-
- Hardcastle JD, Armitage NC, Chamberlain J, Amar SS, James PD, Balfour TW. Fecal occult blood screening for colorectal cancer in the general population. Results of a controlled trial. Cancer. 1986;58(2):397–403. - PubMed
-
- Hewitson P, Glasziou P, Watson E, Towler B, Irwig L. Cochrane systematic review of colorectal cancer screening using the fecal occult blood test (hemoccult): an update. Am J Gastroenterol. 2008;103(6):1541–9. - PubMed
-
- Kronborg O, Fenger C, Olsen J, Jorgensen OD, Sondergaard O. Randomised study of screening for colorectal cancer with faecal-occult-blood test. Lancet. 1996;348(9040):1467–71. - PubMed
-
- Mandel JS, Church TR, Ederer F, Bond JH. Colorectal cancer mortality: effectiveness of biennial screening for fecal occult blood. J Natl Cancer Inst. 1999;91(5):434–7. - PubMed
Appendix References
-
- Vatn MH, Stalsberg H. The prevalence of polyps of the large intestine in Oslo: an autopsy study. Cancer. 1982;49(4):819–25. - PubMed
-
- Arminski TC, McLean DW. Incidence and Distribution of Adenomatous Polyps of the Colon and Rectum Based on 1,000 Autopsy Examinations. Dis Colon Rectum. 1964;7:249–61. - PubMed
-
- Bombi JA. Polyps of the colon in Barcelona, Spain. An autopsy study. Cancer. 1988;61(7):1472–6. - PubMed
-
- Clark JC, Collan Y, Eide TJ, et al. Prevalence of polyps in an autopsy series from areas with varying incidence of large-bowel cancer. Int J Cancer. 1985;36(2):179–86. - PubMed
Publication types
MeSH terms
Grants and funding
LinkOut - more resources
Full Text Sources
Other Literature Sources
Medical

