. 2018 May 1;128(5):2010-2024.
doi: 10.1172/JCI97454. Epub 2018 Apr 9.

Redirection to the bone marrow improves T cell persistence and antitumor functions

Affiliations

Redirection to the bone marrow improves T cell persistence and antitumor functions

Anjum B Khan et al. J Clin Invest. .

Abstract

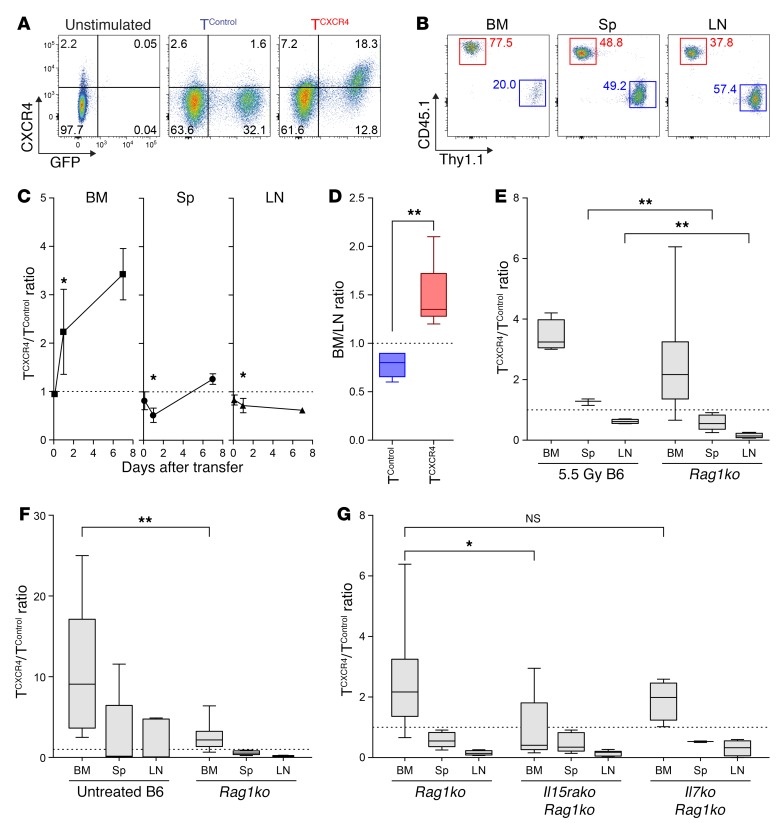
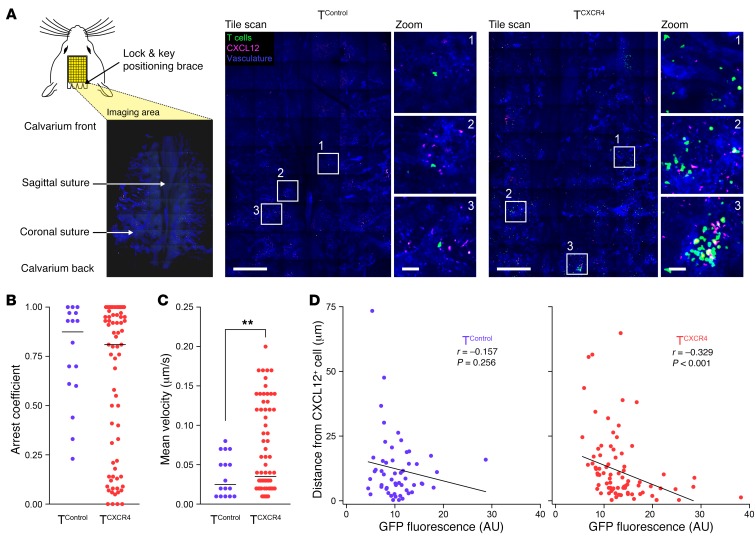
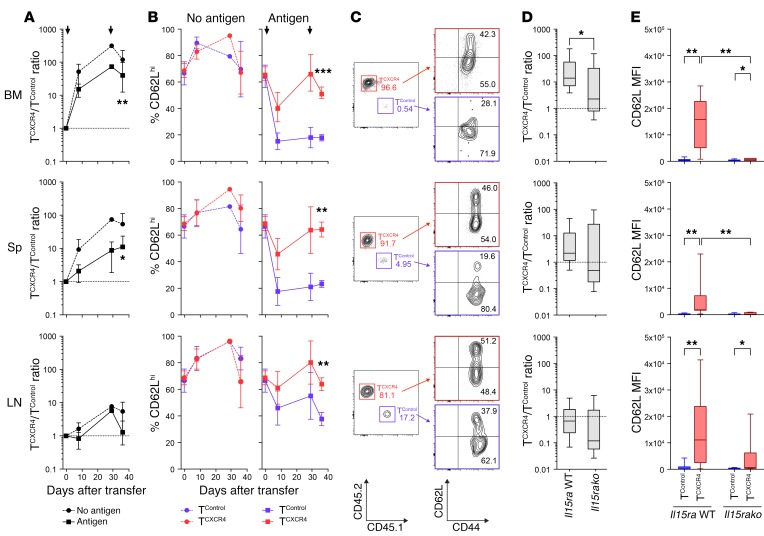
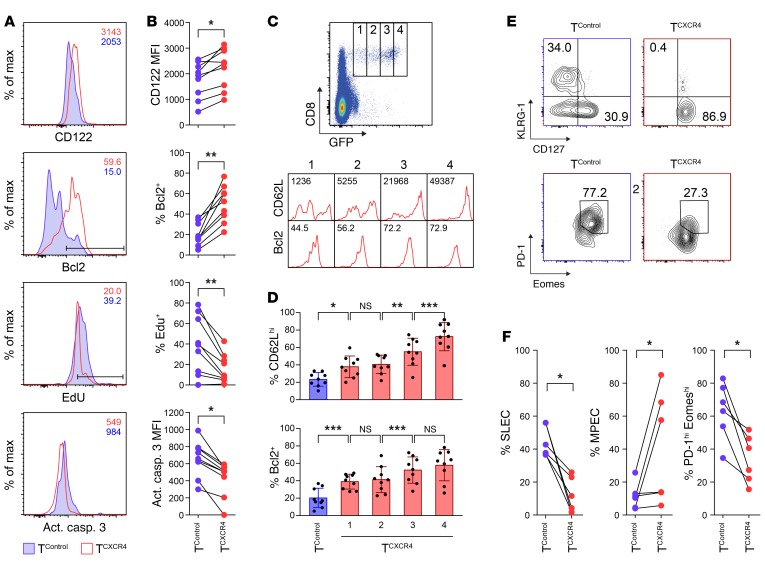
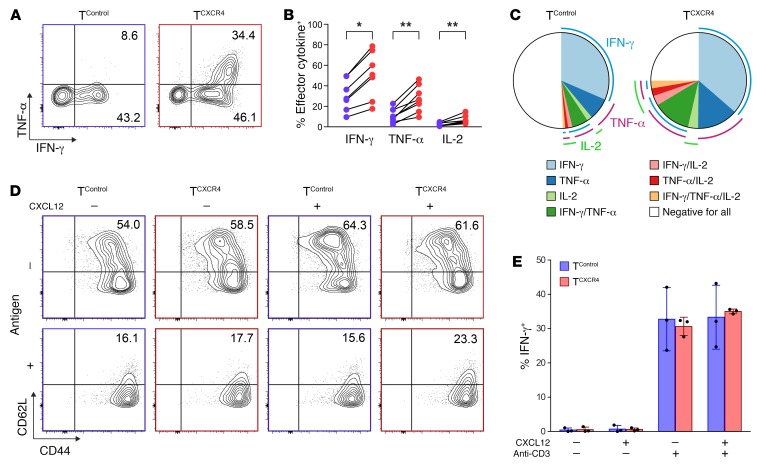
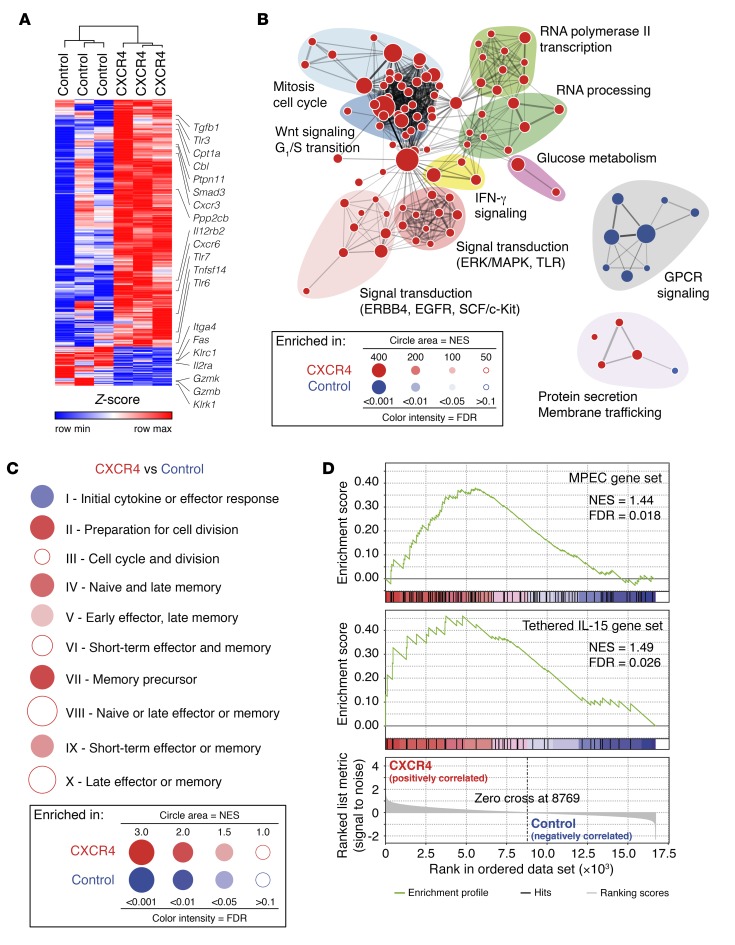
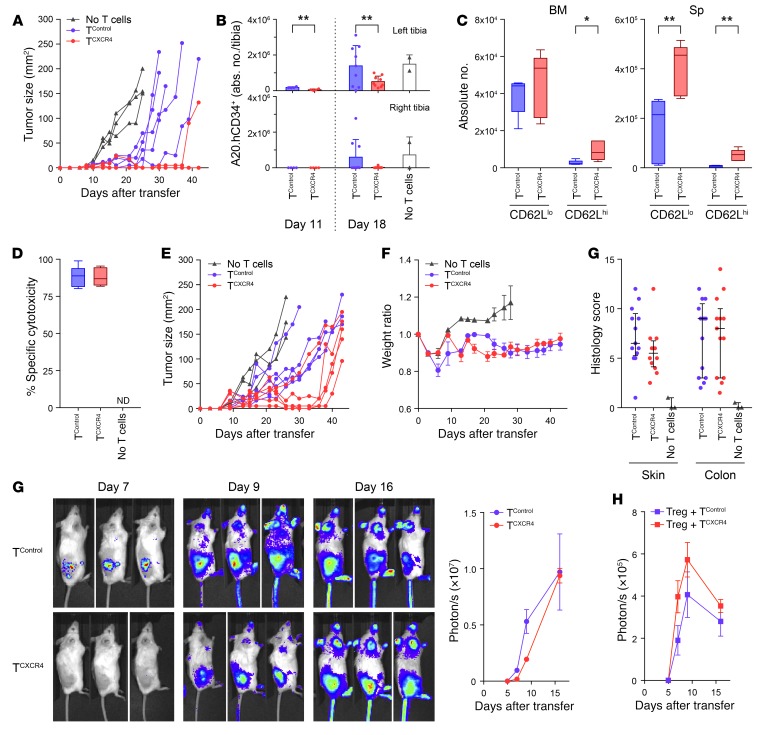
A key predictor for the success of gene-modified T cell therapies for cancer is the persistence of transferred cells in the patient. The propensity of less differentiated memory T cells to expand and survive efficiently has therefore made them attractive candidates for clinical application. We hypothesized that redirecting T cells to specialized niches in the BM that support memory differentiation would confer increased therapeutic efficacy. We show that overexpression of chemokine receptor CXCR4 in CD8+ T cells (TCXCR4) enhanced their migration toward vascular-associated CXCL12+ cells in the BM and increased their local engraftment. Increased access of TCXCR4 to the BM microenvironment induced IL-15-dependent homeostatic expansion and promoted the differentiation of memory precursor-like cells with low expression of programmed death-1, resistance to apoptosis, and a heightened capacity to generate polyfunctional cytokine-producing effector cells. Following transfer to lymphoma-bearing mice, TCXCR4 showed a greater capacity for effector expansion and better tumor protection, the latter being independent of changes in trafficking to the tumor bed or local out-competition of regulatory T cells. Thus, redirected homing of T cells to the BM confers increased memory differentiation and antitumor immunity, suggesting an innovative solution to increase the persistence and functions of therapeutic T cells.

Keywords: Cancer immunotherapy; Chemokines; Immunology; T cells; Therapeutics.


Conflict of interest statement

Conflict of interest: RC and EM are inventors on a patent application (PCT/GB2016/053951) relevant to the work described in this study.

Figures

Figure 1
Figure 1. Adoptively transferred TCXCR4 demonstrate superior recruitment to the BM.
(A) Representative flow cytometry plots for CXCR4 expression in untreated CD8+ T cells (unstimulated), TControl, or TCXCR4. Gating based on “fluorescence minus 1” controls. CXCR4 median fluorescence index (MFI): 380 unstimulated; 587 GFP+ TControl; 2,409 GFP+ TCXCR4. (B and C) Equal mixtures of TCXCR4 (CD45.1+) and TControl (Thy1.1+) were injected into sublethally irradiated B6 mice. Representative plots of TCXCR4 (red) and TControl (blue) frequencies in BM, spleen (Sp), and LN at day 7 are shown in B. Summary graphs in C indicate mean ± SD TCXCR4/TControl ratio at timed intervals in BM, Sp, and LN (n = 6 per group at 3 and 24 hours, n = 4 per group at day 7). Statistical comparison was performed by Wilcoxon’s signed-rank test against a hypothetical ratio of 1.0 (dotted line). *P ≤ 0.05. (D) Box-and-whisker graphs for BM/LN ratio on day 14 following transfer of TCXCR4 or TControl to separate sublethally irradiated B6 mice, calculated by division of percent GFP+ of BM CD8+ T cells by percent GFP+ of LN CD8+ T cells (n = 6 TCXCR4, n = 5 TControl). (E) Box-and-whisker graphs of TCXCR4/TControl ratio in BM, Sp, and LN at day 7 following transfer into sublethally irradiated B6 mice (n = 4) and untreated Rag1ko mice (n = 10). (F) Box-and-whisker graphs of TCXCR4/TControl ratio in BM, Sp, and LN at day 7 following transfer into untreated B6 mice (n = 11) and untreated Rag1ko mice (n = 10). (G) Box-and-whisker graphs of ratio of TCXCR4/TControl in BM, Sp, and LN at day 7 following transfer into Rag1ko (n = 10), Rag1ko.Il15rako (n = 10), and Rag1ko.Il7ko (n = 4). Statistical comparisons in D and E were made using the Mann-Whitney test (2-tailed). *P ≤ 0.05, **P ≤ 0.01. All data are pooled from 2–3 independent experiments.
Figure 2
Figure 2. TCXCR4 show enhanced motility and directed migration to vascular-associated CXCL12+ cells in BM.
(A) Left: Diagram showing strategy for calvarial imaging. Right: Intravital confocal calvarial imaging of transduced T cells (green) was performed 8 weeks after injection of TControl and TCXCR4 into separate Rag1ko mice. Representative maximum projection tile scans and corresponding high-magnification insets are shown following i.v. injection of anti-CXCL12–PE (red) and Cy5-dextran to identify vasculature (blue). Scale bars: 500 μm in low-magnification images, 50 μm in inset images. (B) Summary graph showing arrest coefficient data for time-lapse imaging of TControl and TCXCR4. Data are pooled from 5 mice (n = 2 TControl and n = 3 TCXCR4). Median tracking period was 8.5 min/cell, range 8.5–30 min/cell (total number of cells tracked n = 72 TCXCR4, n = 16 TControl). (C) Summary graph showing mean velocity of tracked cells. Statistical comparison was made using a t test (2-tailed). **P ≤ 0.01. (D) X-y graphs showing GFP intensity (x axis) versus distance (y axis) of individual TControl (n = 54, left) and TCXCR4 (n = 108, right) from CXCL12+ cells measured on static images derived from the same experiments in AC. Inset to each graph shows Pearson’s correlation coefficient r and significance value.
Figure 3
Figure 3. Ag-activated TCXCR4 retain a CD62Lhi phenotype.
Equal numbers of OT-I TCXCR4 and TControl were coinjected into Rag1ko mice, before prime-boost vaccination with relevant SIINFEKL peptide plus IFA (Antigen, n = 17) or irrelevant peptide plus IFA (No antigen, n = 8) on days 1 and 29. Tissues were harvested on day 8 (n = 4 per group), 29 (n = 3 Ag, n = 1 no Ag), and 36 (n = 9 Ag, n = 3 no Ag). Data from 4 independent experiments (with the exception of day 29 no-Ag group derived from 1 experiment). (A) Summary (mean ± SD) TCXCR4/TControl in BM, Sp, and LN over time for no-Ag (circles, dashed lines) and Ag groups (squares, solid line). Arrows indicate time of prime-boost vaccination. (B) Summary (mean ± SD) CD62L expression over time in TCXCR4 (red) and TControl (blue) in no-Ag (left) and Ag groups (right). (C) Representative plots for TCXCR4 and TControl accumulation and surface expression of CD44 and CD62L on day 36 in BM, Sp, and LN. Numbers denote frequencies of TCXCR4 (red), TControl (blue), and proportions of CD62Lhi and CD62Llo cells (black). (D) Box-and-whisker graphs showing summary of TCXCR4/TControl ratios in BM, Sp, and LN on day 36 following transfer into Rag1ko (Il15ra WT, n = 9) and Rag1ko.Il15rako (Il15rako, n = 6) mice undergoing the same prime-boost vaccination schedule outlined in A. Data derived from 3 independent experiments. (E) Box-and-whisker graphs showing summary data for CD62L expression by TControl or TCXCR4 on day 36 in the same experiments outlined in D. In A and D, statistical comparisons were made by Wilcoxon’s signed-rank test against a hypothetical ratio of 1.0 (dotted line). *P ≤ 0.05, **P ≤ 0.01. In B, C, and E, statistical comparisons were made using the Mann-Whitney test (2-tailed). *P ≤ 0.05, **P ≤ 0.01, ***P ≤ 0.001.
Figure 4
Figure 4. Ag-activated TCXCR4 adopt a less differentiated memory phenotype.
Equal numbers of OT-I TCXCR4 and TControl were coinjected into Rag1ko mice, which then underwent prime-boost vaccination with relevant SIINFEKL peptide plus IFA on days 1 and 29. Tissues were harvested on day 36 (n = 9); data are pooled from 4 independent experiments. (A and B) Representative flow cytometric histograms (A) and summary data (B) for expression of surface IL-15Rβ (CD122), intracellular Bcl2, EdU incorporation, and caspase-3 activity in TControl (blue) versus TCXCR4 (red) on day 36 in cells isolated from the BM. Statistical significance was tested using Wilcoxon’s ranked-sum test (2-tailed). *P ≤ 0.05, **P ≤ 0.01. (C and D) Representative flow cytometric histograms (C) and summary data (mean ± SD) (D) for CD62L and Bcl2 staining in BM TCXCR4 gated according to GFP reporter expression (gates 1–4).Numbers shown as insets of the flow cytometric histograms relate to CD62L median fluorescence index (MFI) and proportion of Bcl2+ cells in the gated subset. Statistical significance was tested using the Mann-Whitney test (2-tailed). *P ≤ 0.05, **P ≤ 0.01, ***P ≤ 0.001. (E and F) Representative flow cytometric contour plots (E) and summary data (F) for frequency of splenic TControl (blue) and TCXCR4 (red) with short-lived effector cell (SLEC) (KLRG-1hiCD127lo), MPEC (KLRG-1loCD127hi), and exhausted (PD-1hiEomeshi) phenotypes on day 36 (n = 5). Statistical significance was tested using Wilcoxon’s ranked-sum test (2-tailed). *P ≤ 0.05.
Figure 5
Figure 5. Ag-activated TCXCR4 have increased potential for polyfunctional cytokine generation.
Equal numbers of OT-I TCXCR4 and OT-I TControl were coinjected into Rag1ko mice, which then underwent prime-boost vaccination with relevant SIINFEKL peptide plus IFA on days 1 and 29. T cells were isolated from the spleen on day 36 (n = 7). (A) Representative flow cytometric contour plots showing IFN-γ and TNF-α intracellular costaining in OT-I TCXCR4 and OT-I TControl after ex vivo stimulation with relevant peptide with gates set according to stimulation with irrelevant peptide. (B) Summary data for IFN-γ, TNF-α, and IL-2 generation from OT-I TControl (blue) and OT-I TCXCR4 (red) in the same assays. Statistical significance tested using the Wilcoxon ranked sum test (two-tailed), *P ≤ 0.05, **P ≤ 0.01. (C) Pie charts depicting polyfunctional cytokine generation in TControl and TCXCR4 according to Boolean combination gates identifying IFN-γ+, TNF‑α+, and IL-2+ cells. (D) Transduced OT-I TCXCR4 and OT-I TControl were stimulated in vitro with relevant or irrelevant peptide and in the absence or presence of 500 ng/ml of recombinant murine CXCL12. Representative flow cytometric contour plots showing CD44 and CD62L surface expression. Data shown are representative of 2 independent experiments. (E) Summary data (mean ± SD) for intracellular IFN-γ generation after in vitro stimulation with anti-CD3 in the presence or absence of CXCL12 (n = 3 from 3 independent experiments).
Figure 6
Figure 6. Resting memory TCXCR4 possess a memory precursor–like signature.
(A) Heatmap showing the relative expression levels of the genes differentially expressed between resting memory OT-I TCXCR4 and controls (fold change ≥1.5, P ≤ 0.01); labels identify specific genes as discussed in the text. (B) The network map displays the Reactome gene sets enriched in OT-I TCXCR4 versus OT-I TControl. Node area indicates the size of the gene set; color code reflects enrichment in OT-I TCXCR4 (red) or OT-I TControl (blue); color intensity is proportional to statistical significance. Clusters of functionally related gene sets were manually circled and assigned a label. NES, normalized enrichment score. (C) Gene set enrichment analysis–based (GSEA-based) assessment of the stage of antigenic response of OT-I TCXCR4 and OT-I TControl according to the 10 phase-specific gene sets identified by Best et al. (42). Results are represented in a BubbleGUM plot, in which stronger and more significant enrichments are represented by larger and darker bubbles, colored red for OT-I TCXCR4 or blue for OT-I TControl. (D) GSEA plots showing that memory OT-I TCXCR4 upregulate genes associated with early memory cells and with increased responsiveness to IL-15.
Figure 7
Figure 7. TCXCR4 demonstrate enhanced tumor protection.
All mice underwent B6→BALB/c BMT. (A) A20 tumors were implanted on day 0; 2 days later, recipients received CD8+ allo-TControl (blue circles, n = 5), CD8+ allo-TCXCR4 (red circles, n = 5), or no T cells (black triangles, n = 3). Graph shows tumor size at timed intervals. (B) A20.hCD34+ cells were given by intraosseous injection to the left tibia on day 0; 2 days later, recipients received CD8+ allo-TControl (blue circles, n = 4 day 11, n = 9 day 18), 1 × 10⁶ CD8+ allo-TCXCR4 (red circles, n = 4 day 11, n = 9 day 18), or no T cells (black triangles, n = 2 day 18). Graphs show mean ± SD A20.hCD34+ accumulation in ipsilateral (left) and contralateral (right) tibia. Data pooled from 2 experiments. (C) CD8+ allo-TControl or allo-TCXCR4 were given on day 2 (n = 5 per group); graph shows absolute numbers of CD62Lhi and CD62Llo donor CD8+ T cells on day 10 post-BMT. *P ≤ 0.05, **P ≤ 0.01 Mann-Whitney test, 2-tailed. (D) Allo-TControl and allo-TCXCR4 (n = 7 per group), or no T cells (n = 3), were given on day 2; graph shows in vivo specific cytotoxicity against BALB/c B cells on day 10 post-BMT. ND, no data. (E) A20 tumors were implanted s.c. on day 0; 2 days later, BMT recipients received no T cells (black triangles, n = 3), CD3+ allo-TControl (blue circles, n = 5), or CD3+ allo-TCXCR4 (red circles, n = 5). Graph shows tumor size at timed intervals. (F) Experimental design as in E. Weight ratio and histological GVHD score on day 10 post-BMT (allo-TControl, n = 13; allo-TCXCR4, n = 13; no T cells, n = 3). Data pooled from 2 experiments. (G) On day 2, luc+ CD3+ allo-TControl or allo-TCXCR4 were transferred to BMT recipients bearing subcutaneous A20 tumors. T cell infiltration was monitored at timed intervals (mean ± SD, n = 3 per group). (H) Mean ± SD luc+ Treg accumulation at timed intervals within A20 tumors following cotransfer on day 2 in a 1:1 ratio with non-luc+ TControl (blue squares) or TCXCR4 (red squares).

References

    1. Brentjens RJ, et al. CD19-targeted T cells rapidly induce molecular remissions in adults with chemotherapy-refractory acute lymphoblastic leukemia. Sci Transl Med. 2013;5(177):177ra38. - PMC - PubMed
    1. Brentjens RJ, et al. Safety and persistence of adoptively transferred autologous CD19-targeted T cells in patients with relapsed or chemotherapy refractory B-cell leukemias. Blood. 2011;118(18):4817–4828. doi: 10.1182/blood-2011-04-348540. - DOI - PMC - PubMed
    1. Cruz CR, et al. Infusion of donor-derived CD19-redirected virus-specific T cells for B-cell malignancies relapsed after allogeneic stem cell transplant: a phase 1 study. Blood. 2013;122(17):2965–2973. doi: 10.1182/blood-2013-06-506741. - DOI - PMC - PubMed
    1. Dudley ME, et al. Adoptive cell therapy for patients with metastatic melanoma: evaluation of intensive myeloablative chemoradiation preparative regimens. J Clin Oncol. 2008;26(32):5233–5239. doi: 10.1200/JCO.2008.16.5449. - DOI - PMC - PubMed
    1. Louis CU, et al. Antitumor activity and long-term fate of chimeric antigen receptor-positive T cells in patients with neuroblastoma. Blood. 2011;118(23):6050–6056. doi: 10.1182/blood-2011-05-354449. - DOI - PMC - PubMed

Publication types

MeSH terms