. 2018 Feb 27;15(2):e1002509.
doi: 10.1371/journal.pmed.1002509. eCollection 2018 Feb.

The potential impact of case-area targeted interventions in response to cholera outbreaks: A modeling study

Affiliations

The potential impact of case-area targeted interventions in response to cholera outbreaks: A modeling study

Flavio Finger et al. PLoS Med. .

Abstract

Background: Cholera prevention and control interventions targeted to neighbors of cholera cases (case-area targeted interventions [CATIs]), including improved water, sanitation, and hygiene, oral cholera vaccine (OCV), and prophylactic antibiotics, may be able to efficiently avert cholera cases and deaths while saving scarce resources during epidemics. Efforts to quickly target interventions to neighbors of cases have been made in recent outbreaks, but little empirical evidence related to the effectiveness, efficiency, or ideal design of this approach exists. Here, we aim to provide practical guidance on how CATIs might be used by exploring key determinants of intervention impact, including the mix of interventions, "ring" size, and timing, in simulated cholera epidemics fit to data from an urban cholera epidemic in Africa.

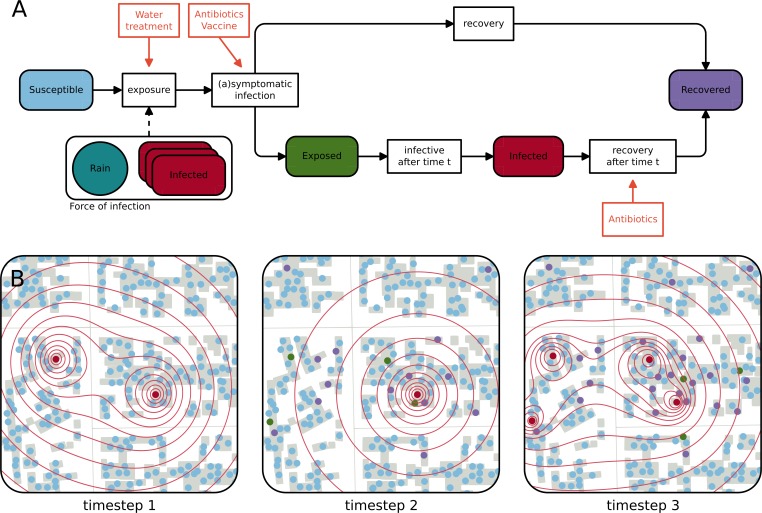
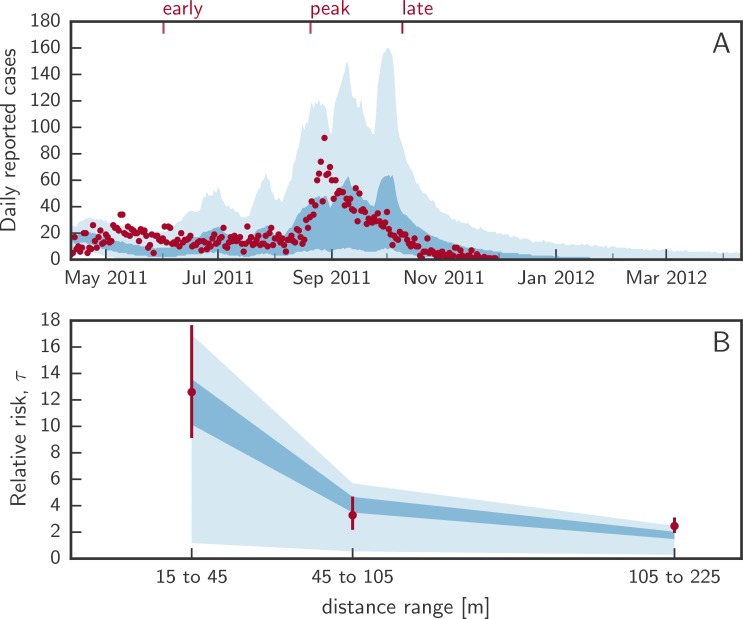
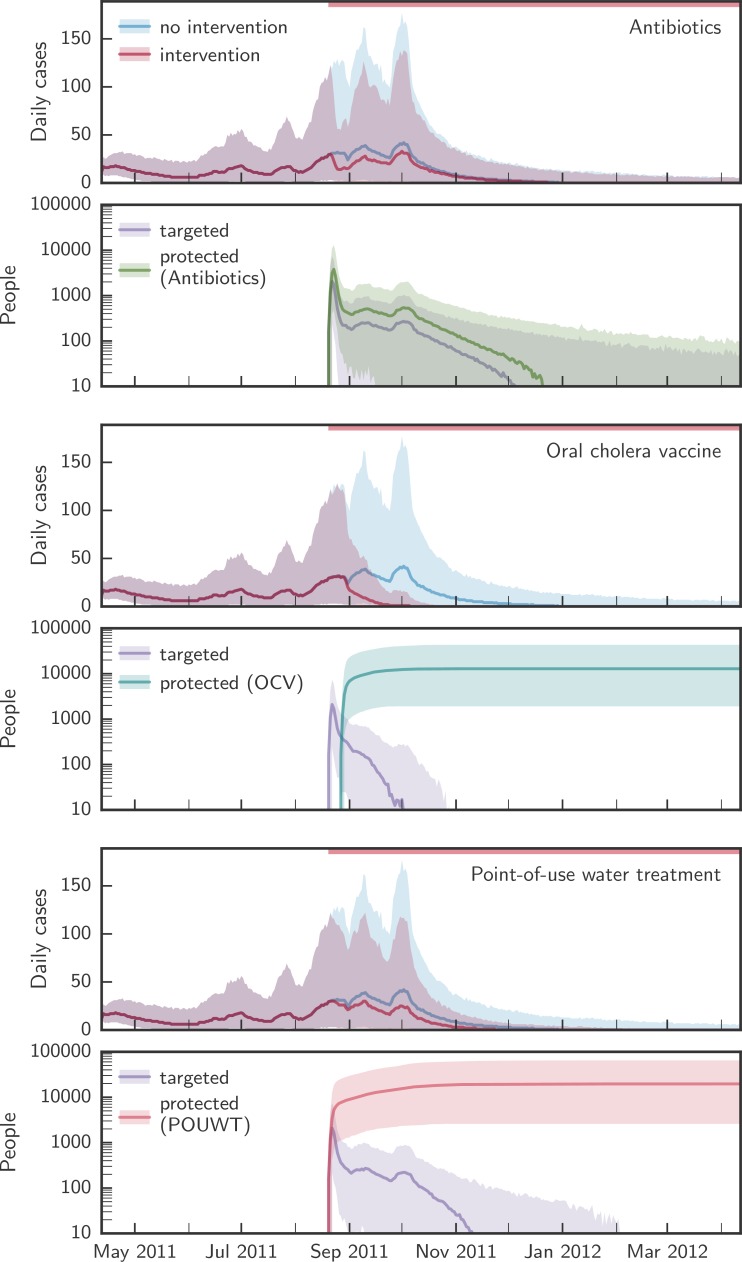
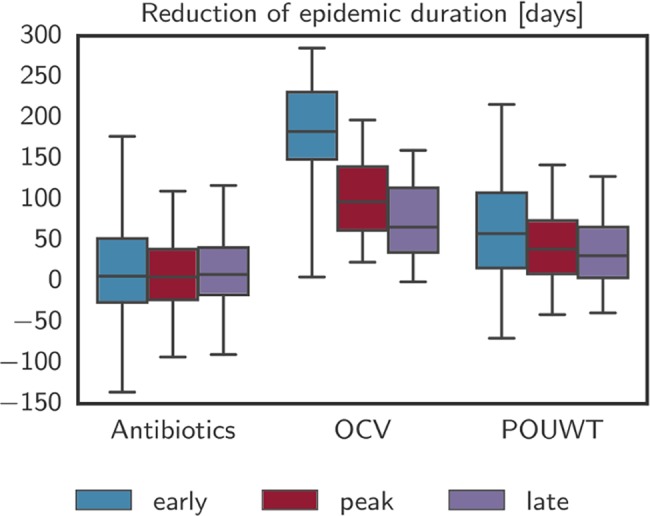
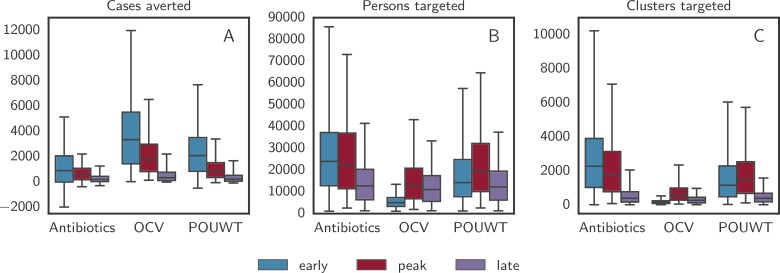
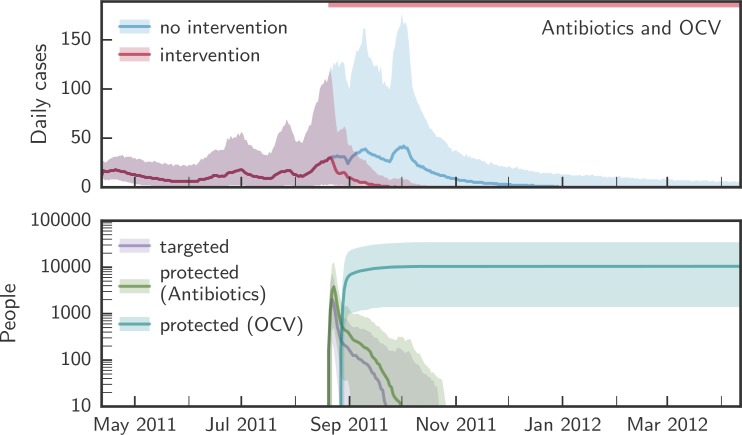
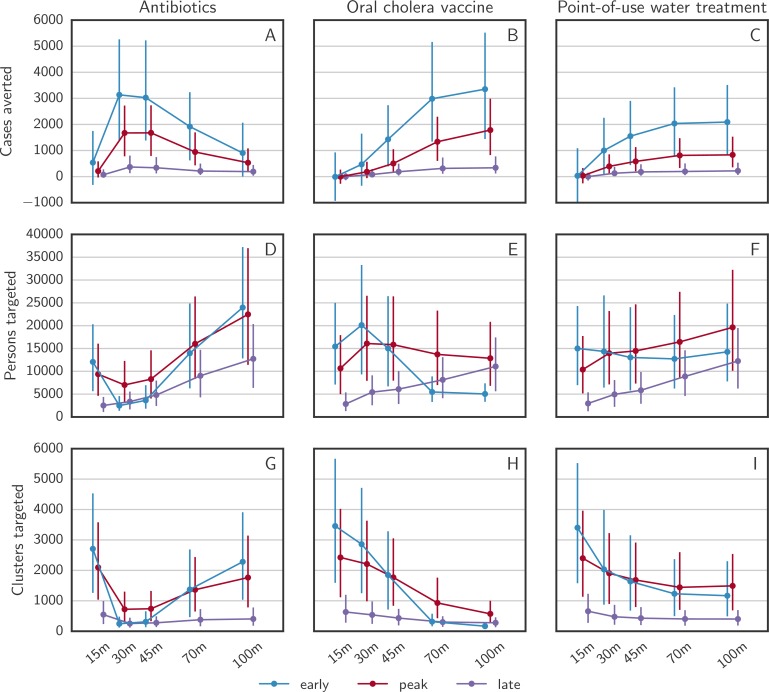
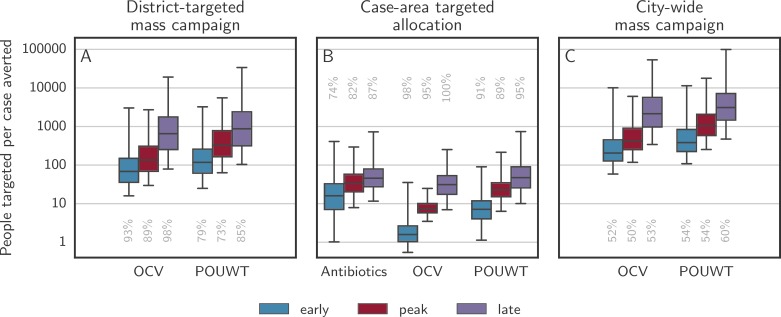
Methods and findings: We developed a micro-simulation model and calibrated it to both the epidemic curve and the small-scale spatiotemporal clustering pattern of case households from a large 2011 cholera outbreak in N'Djamena, Chad (4,352 reported cases over 232 days), and explored the potential impact of CATIs in simulated epidemics. CATIs were implemented with realistic logistical delays after cases presented for care using different combinations of prophylactic antibiotics, OCV, and/or point-of-use water treatment (POUWT) starting at different points during the epidemics and targeting rings of various radii around incident case households. Our findings suggest that CATIs shorten the duration of epidemics and are more resource-efficient than mass campaigns. OCV was predicted to be the most effective single intervention, followed by POUWT and antibiotics. CATIs with OCV started early in an epidemic focusing on a 100-m radius around case households were estimated to shorten epidemics by 68% (IQR 62% to 72%), with an 81% (IQR 69% to 87%) reduction in cases compared to uncontrolled epidemics. These same targeted interventions with OCV led to a 44-fold (IQR 27 to 78) reduction in the number of people needed to target to avert a single case of cholera, compared to mass campaigns in high-cholera-risk neighborhoods. The optimal radius to target around incident case households differed by intervention type, with antibiotics having an optimal radius of 30 m to 45 m compared to 70 m to 100 m for OCV and POUWT. Adding POUWT or antibiotics to OCV provided only marginal impact and efficiency improvements. Starting CATIs early in an epidemic with OCV and POUWT targeting those within 100 m of an incident case household reduced epidemic durations by 70% (IQR 65% to 75%) and the number of cases by 82% (IQR 71% to 88%) compared to uncontrolled epidemics. CATIs used late in epidemics, even after the peak, were estimated to avert relatively few cases but substantially reduced the number of epidemic days (e.g., by 28% [IQR 15% to 45%] for OCV in a 100-m radius). While this study is based on a rigorous, data-driven approach, the relatively high uncertainty about the ways in which POUWT and antibiotic interventions reduce cholera risk, as well as the heterogeneity in outbreak dynamics from place to place, limits the precision and generalizability of our quantitative estimates.

Conclusions: In this study, we found that CATIs using OCV, antibiotics, and water treatment interventions at an appropriate radius around cases could be an effective and efficient way to fight cholera epidemics. They can provide a complementary and efficient approach to mass intervention campaigns and may prove particularly useful during the initial phase of an outbreak, when there are few cases and few available resources, or in order to shorten the often protracted tails of cholera epidemics.


Conflict of interest statement

I have read the journal's policy and the authors of this manuscript have the following competing interests: JL is a paid statistical advisor for PLOS Medicine.

Figures

Fig 1
Fig 1. Schematic representation of the epidemiological model and evolution of the infectious state of inhabitants of a neighborhood.
(A) Flow chart of the model representing the different epidemiological states a person can be in and the processes that lead to a change of state. The force of infection acting on a susceptible individual depends on the number of infected individuals and the distance to each of them as well as on rainfall during the last 10 days. Orange boxes represent pathways through which interventions (antibiotics, oral cholera vaccine, and point-of-use water treatment) influence the processes in the model. (B) Schematic representation of the evolution of the epidemiological state of the inhabitants of a neighborhood in N’Djamena during 3 timesteps. The closer susceptible people (blue dots) live to an infected individual (red dots), the higher the force of infection (red contours) they face. Susceptible individuals can get symptomatically infected, which means that they get exposed (green dots) and go on to become infectious after their incubation period (red dots), and thus contribute to the force of infection, or asymptomatically infected, in which case they are assumed to recover (purple dots). Infected individuals recover after a given duration. Between timesteps 1 and 2, 1 infected person recovered, 4 susceptible individuals got exposed, and 14 susceptible individuals contracted an asymptomatic infection. At timestep 3, the individuals infected at timestep 1 have recovered, and all exposed individuals have become symptomatic.
Fig 2
Fig 2. Calibrated model fit.
(A) shows the distribution of daily incident cholera cases from uncontrolled epidemic simulations. The shaded areas represent the marginal interquartile range (dark blue) and the 2.5th and 97.5th percentiles (light blue) from 1,000 simulated epidemics with the true number of daily reported cases shown as red dots. Red ticks at the top represent the 3 times when interventions start. (B) shows the interquartile range (dark blue) and 2.5th and 97.5th posterior percentiles (light blue) of the relative risk (τ statistic) of the next case being within a specific distance from a case within 5 days of his/her symptom onset. Red dots and bars (95% confidence intervals) represent the computed τ from the data.
Fig 3
Fig 3. Comparison of the simulated evolution of epidemics with and without case-area targeted interventions.
Upper panels in each pair of panels show the simulated evolution of the epidemics without intervention and with case-area targeted allocation of antibiotics, OCV, or POUWT within a 100-m radius starting at the epidemic peak. Lower panels in each pair of panels show the corresponding number of people targeted daily and the number of people protected by each intervention. Solid lines designate the median over all simulations, shaded areas the 2.5th and 97.5th percentiles. The red bars at the top of the panels mark the period during which interventions were applied. OCV, oral cholera vaccine; POUWT, point-of-use water treatment.
Fig 4
Fig 4. Reduction of epidemic duration with case-area targeted interventions.
Reduction of epidemic duration predicted by the model for the 3 main intervention types with case-area targeted allocation in a 100-m radius starting at 3 different times. Whiskers mark the 2.5th and 97.5th percentiles. Negative numbers of days, such as visible for antibiotics, are due to stochastic effects that arise when an intervention alters the course of a particular epidemic without halting it and leads to a higher number of cases at a later point in time. OCV, oral cholera vaccine; POUWT, point-of-use water treatment.
Fig 5
Fig 5. Outcome of the 3 main interventions with case-area targeted allocation in a 100-m radius.
Boxplots of (A) the number of averted cases, (B) the number of targeted persons, and (C) the number of targeted clusters predicted by the model for the 3 main intervention types with case-area targeted allocation in a 100-m radius starting at 3 different times. Whiskers mark the 2.5th and 97.5th percentiles. Negative numbers of averted cases, such as those given for antibiotics, are due to stochastic effects that arise when an intervention alters the course of a particular epidemic without halting it and leads to a higher number of cases at a later point in time. OCV, oral cholera vaccine; POUWT, point-of-use water treatment.
Fig 6
Fig 6. CATIs within a radius of 100 m combining antibiotics and OCV.
The upper panel shows the simulated evolution of the epidemics without intervention (blue) and with simultaneous CATIs (red) using antibiotics and OCV within a 100-m radius starting around the epidemic peak. The lower panel shows the number of people targeted each day (purple), and the number of people protected by antibiotics (green) and OCV (blue). Solid lines show the median over all simulations; shaded areas represent the 2.5th and 97.5th percentiles. The red bar at the top of the figure marks the period during which the intervention was applied. CATI, case-area targeted intervention; OCV, oral cholera vaccine; POUWT, point-of-use water treatment.
Fig 7
Fig 7. Intervention outcomes as a function of distance in case-area targeted allocations.
The numbers of (A–C) averted cases, (D–F) targeted persons, and (G–I) targeted clusters predicted by the model for the 3 main intervention types with case-area targeted allocation and variable radius, starting at 3 different times. The error bars cover the range between the 25th and the 75th quantile over all simulations.
Fig 8
Fig 8. Persons needed to target per case averted for district-targeted mass campaigns, CATIs, and city-wide mass campaigns.
Boxplots show the number of persons needed to target to avert 1 case when using antibiotics, OCV, and POUWT using different allocation approaches. (A) illustrates campaigns targeting 70% of the population of the 3 districts with the highest attack rate at the time of intervention. Mass allocation of antibiotics was not considered as it is unlikely to be a realistic approach. (B) illustrates CATIs at a radius of 100 m. (C) illustrates campaigns targeting 70% of the population of the entire city. Whiskers mark the 2.5th and 97.5th percentiles. Only model runs with a positive number of cases averted were considered, with the grey numbers aligned with each box illustrating the percentage of such runs among all simulations. CATI, case-area targeted intervention; OCV, oral cholera vaccine; POUWT, point-of-use water treatment.

References

    1. World Health Organization. Cholera, 2016. Wkly Epidemiol Rec. 2017;92(36):521–36. - PubMed
    1. Ali M, Nelson AR, Lopez AL, Sack DA. Updated global burden of cholera in endemic countries. PLoS Negl Trop Dis. 2015;9(6):e0003832 doi: 10.1371/journal.pntd.0003832 - DOI - PMC - PubMed
    1. Luquero FJ, Rondy M, Boncy J, Munger A, Mekaoui H, Rymshaw E, et al. Mortality rates during cholera epidemic, Haiti, 2010–2011. Emerg Infect Dis. 2016;22(3):410–6. doi: 10.3201/eid2203.141970 - DOI - PMC - PubMed
    1. Rebaudet S, Sudre B, Faucher B, Piarroux R. Cholera in coastal Africa: a systematic review of its heterogeneous environmental determinants. J Infect Dis. 2013;208(Suppl 1):S98–106. doi: 10.1093/infdis/jit202 - DOI - PubMed
    1. Rebaudet S, Sudre B, Faucher B, Piarroux R. Environmental determinants of cholera outbreaks in inland Africa: a systematic review of main transmission foci and propagation routes. J Infect Dis. 2013;208(Suppl 1):S46–54. doi: 10.1093/infdis/jit195 - DOI - PubMed

Publication types

MeSH terms

Substances