

Comparison of the effect of daily versus bolus dose maternal vitamin D3 supplementation on the 24,25-dihydroxyvitamin D3 to 25-hydroxyvitamin D3 ratio
- PMID: 29486367
- PMCID: PMC5878742
- DOI: 10.1016/j.bone.2018.02.024
Comparison of the effect of daily versus bolus dose maternal vitamin D3 supplementation on the 24,25-dihydroxyvitamin D3 to 25-hydroxyvitamin D3 ratio
Abstract
Objective: Supplementing lactating mothers with high doses of vitamin D3 can adequately meet vitamin D requirements of the breastfed infant. We compared the effect of bolus versus daily vitamin D3 dosing in lactating mothers on vitamin D3 catabolism. We hypothesized that catabolism of 25(OH)D3 to 24,25(OH)2D3 would be greater in the bolus than in the daily dose group.
Design, setting and patients: Randomized controlled trial (clinicaltrials.govNCT01240265) in 40 lactating women.
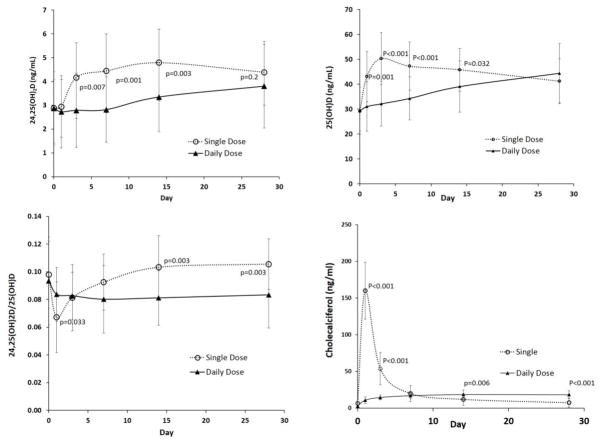
Interventions: Subjects were randomized to receive vitamin D3 orally, either a single dose of 150,000IU or 5000IU daily for 28days. Vitamin D metabolites were measured in serum and breast milk at baseline, 1, 3, 7, 14 and 28days.
Main outcome measure: Temporal changes in the serum 24,25(OH)2D3/25(OH)D3 ratio.
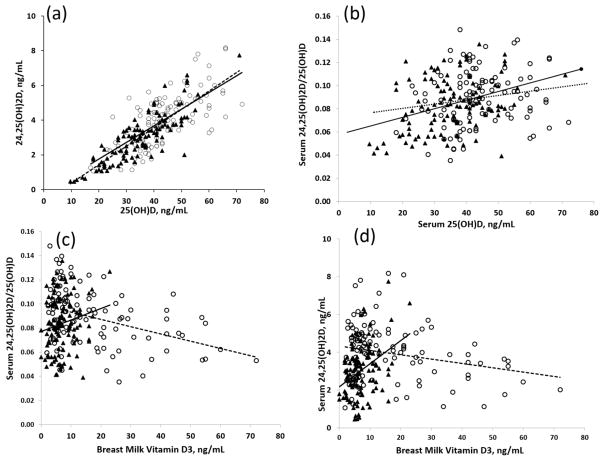
Results: The concentration of serum 24,25(OH)2D3 was directly related to that of 25(OH)D in both groups (r2=0.63; p<0.001). The mean (±SD) 24,25(OH)2D3/25(OH)D3 ratio remained lower at all time points than baseline values in the daily dose group (0.093±0.024, 0.084±0.025, 0.083±0.024, 0.080±0.020, 0.081±0.023, 0.083±0.018 at baseline, 1, 3, 7, 14, and 28days, respectively). In the single dose group, the increase in 24,25(OH)2D3 lagged behind that of 25(OH)D, but the 24,25(OH)2D3/25(OH)D3 values (0.098±0.032, 0.067±0.019, 0.081±0.017, 0.092±0.024, 0.103±0.020, 0.106±0.024, respectively) exceeded baseline values at 14 and 28days and were greater than the daily dose group at 14 and 28days (p=0.003). The 24,25(OH)2D3/25(OH)D3 ratio remained in the normal range with both dosing regimens. Greater breast milk vitamin D3 values in the single dose group were inversely associated with the 24,25(OH)2D3/25(OH)D3 ratio (r2=0.14, p<0.001), but not with daily dosing.
Conclusions: After a 14-day lag, a single high dose of vitamin D led to greater production of 24,25(OH)2D3, presumably via induction of the 24-hydroxylase enzyme (CYP24A1), relative to the 25(OH)D3 value than did daily vitamin D supplementation, and this effect persisted for at least 28days after vitamin D administration. A daily dose of vitamin D may have more lasting effectiveness in increasing 25(OH)D3 with lesser diversion of 25(OH)D3 to 24,25(OH)2D3 than does larger bolus dosing.
Keywords: Catabolism; LC-MS/MS; Lactation; Nutrition; Safety; Vitamin D metabolism.
Copyright © 2018 Elsevier Inc. All rights reserved.
Figures
References
-
- Reeve LE, Chesney RW, DeLuca HF. Vitamin D of human milk: identification of biologically active forms. Am J Clin Nutr. 1982;36:122–6. - PubMed
-
- Hollis BW, Roos BA, Draper HH, Lambert PW. Vitamin D and its metabolites in human and bovine milk. J Nutr. 1981;111:1240–8. - PubMed
-
- Dietary Reference Intakes for Calcium and Vitamin D. The National Academies Press; 2011. - PubMed
Publication types
MeSH terms
Substances
Associated data
Grants and funding
LinkOut - more resources
Full Text Sources
Other Literature Sources
Medical
