. 2018 Feb 28;16(1):24.
doi: 10.1186/s12915-018-0491-x.

Cross-communication between Gi and Gs in a G-protein-coupled receptor heterotetramer guided by a receptor C-terminal domain

Affiliations

Cross-communication between Gi and Gs in a G-protein-coupled receptor heterotetramer guided by a receptor C-terminal domain

Gemma Navarro et al. BMC Biol. .

Abstract

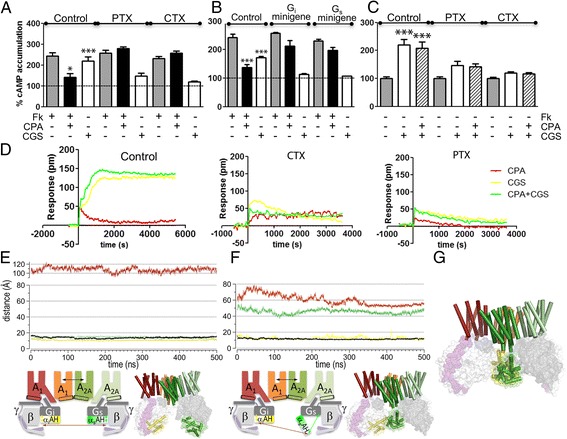
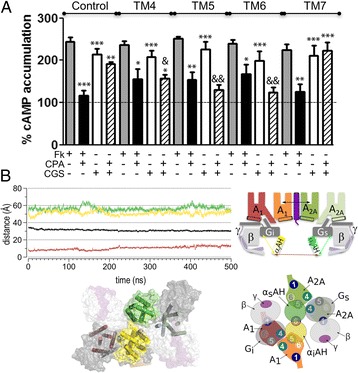
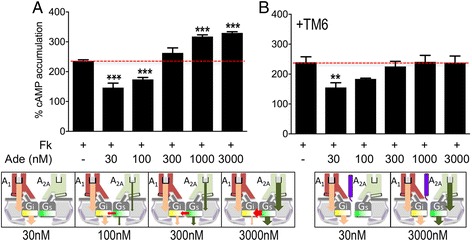
Background: G-protein-coupled receptor (GPCR) heteromeric complexes have distinct properties from homomeric GPCRs, giving rise to new receptor functionalities. Adenosine receptors (A1R or A2AR) can form A1R-A2AR heteromers (A1-A2AHet), and their activation leads to canonical G-protein-dependent (adenylate cyclase mediated) and -independent (β-arrestin mediated) signaling. Adenosine has different affinities for A1R and A2AR, allowing the heteromeric receptor to detect its concentration by integrating the downstream Gi- and Gs-dependent signals. cAMP accumulation and β-arrestin recruitment assays have shown that, within the complex, activation of A2AR impedes signaling via A1R.

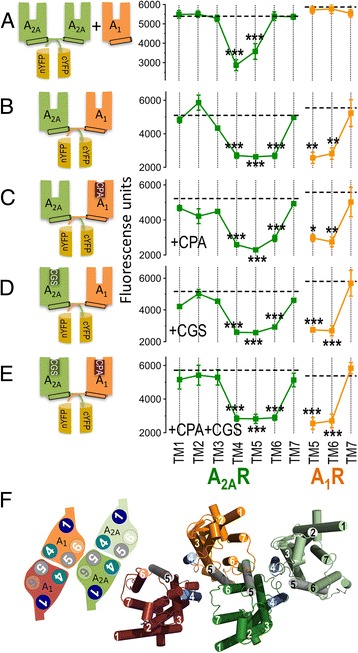
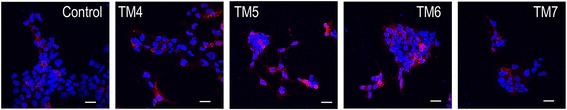
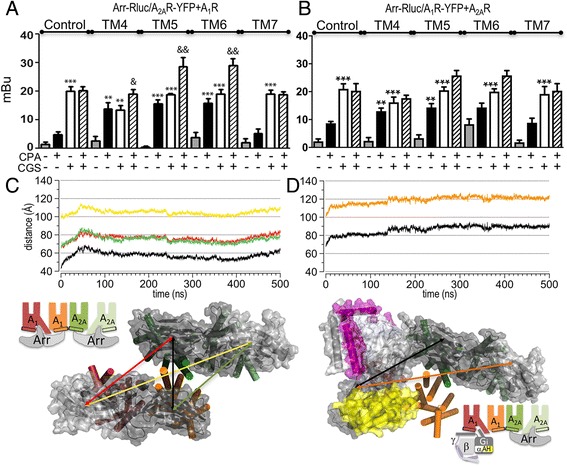
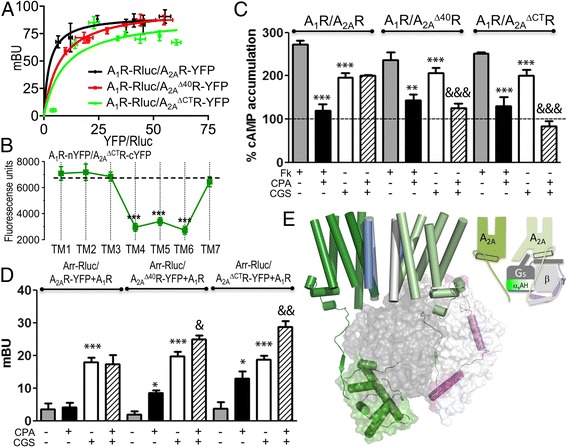
Results: We examined the mechanism by which A1-A2AHet integrates Gi- and Gs-dependent signals. A1R blockade by A2AR in the A1-A2AHet is not observed in the absence of A2AR activation by agonists, in the absence of the C-terminal domain of A2AR, or in the presence of synthetic peptides that disrupt the heteromer interface of A1-A2AHet, indicating that signaling mediated by A1R and A2AR is controlled by both Gi and Gs proteins.

Conclusions: We identified a new mechanism of signal transduction that implies a cross-communication between Gi and Gs proteins guided by the C-terminal tail of the A2AR. This mechanism provides the molecular basis for the operation of the A1-A2AHet as an adenosine concentration-sensing device that modulates the signals originating at both A1R and A2AR.

Keywords: BRET; C-terminal domain; GPCR; Heterotetramer; Molecular modeling.


Conflict of interest statement

Ethics approval and consent to participate

Not applicable.

Competing interests

The authors declare that they have no competing interests.

Publisher’s note

Springer Nature remains neutral with regard to jurisdictional claims in published maps and institutional affiliations.

Figures

Fig. 1
Fig. 1
Effect of interference peptides on the A1-A2AHet structure determined by bimolecular fluorescence complementation (BiFC) assays. ae BiFC assays were performed in HEK-293 T cells transfected with cDNAs (1 μg) for A2AR-nYFP, A2AR-cYFP, and non-fused A1R (a) or A2AR-cYFP and A1R-nYFP (be). Cells were pre-treated for 4 h with medium (control, broken lines) or with 4 μM of A2AR TM synthetic peptides (TM1 to TM7, green squares) or A1R synthetic peptides (TM5 to TM7, orange squares). Subsequently, they were left untreated (a, b) or activated for 10 min with the A1R agonist CPA (c, 100 nM), the A2AR agonist CGS-21680 (d, 100 nM), or both (e). Fluorescence was read at 530 nm. Mean ± SEM (13 experiments/treatment). One-way ANOVA followed by a Dunnett’s multiple comparison test showed a significant fluorescence decrease over control values (*P < 0.05, **P < 0.01, ***P < 0.001). In each panel, there is a schematic representation of the BiFC pairs and conditions. (f) Schematic slice (left) and cartoon (right) representations of the A1-A2AHet built using the predicted experimental interfaces
Fig. 2
Fig. 2
Effect of interference peptides on the A1-A2AHet structure determined by proximity ligation assay (PLA) confocal microscopy images (superimposed sections) in which A1-A2AHets appear as red spots. HEK-293 T cells expressing A1R and A2AR were treated for 4 h with medium (control) or 4 μM of indicated TM peptides of A2AR; cell nuclei were stained with DAPI (blue); scale bars: 10 μm
Fig. 3
Fig. 3
Receptor signaling through the A1-A2AHet. Increases in cAMP percentage accumulation with respect to Fk-stimulated (a, b) or unstimulated (c) cells. A1-A2AHet-expressed cells pre-treated with medium, PTX (10 ng/mL overnight) or CTX (100 ng/mL for 1 h) before adding medium, forskolin (Fk, 0.5 μM), CPA (100 nM) plus/minus forskolin, CGS-21680 (100 nM) plus/minus forskolin, or CPA + CGS-21680. b Same assays in the absence or presence of 0.5 μg of cDNA corresponding to Gi- or Gs-α-subunit-related minigenes. Mean ± SEM (7 experiments/group). One-way ANOVA followed by Bonferroni’s post-hoc test in panels a, b showed a significant effect over basal in samples treated with CGS-21680 or over forskolin in samples treated with CPA; in panel c, a significant effect is seen over basal (*P < 0.05, ***P < 0.001). d The dynamic mass redistribution analysis was plotted as pm shifts versus time (Representative experiment, performed in triplicate). e, f Distances between the Cα atoms of Arg90 (αiAH domain) and Glu238 (Ras domain) of Gi (in yellow), Asn112 (αsAH) and Asn261 (Ras) of Gs (green), Arg90 (αiAH) and Asn112 (αsAH) (dark red), and between the center of masses of the binding sites of the Gi-unbound A1R and Gs-unbound A2AR protomers (black) obtained from two independent molecular dynamics (MD) simulations of A1-A2AHet in complex with Gi and Gs in which αiAH was modelled in the closed conformation (Additional file 1: Figure S6C) and αsAH was modelled in closed (e) or open (f) conformation. The computed distances are depicted as double arrows in the adjacent schematic representations. Representative snapshots of the models are shown. Code: Gi-bound A1R/red, Gi-unbound A1R/orange, Gs-bound A2AR/light green, Gs-unbound A2AR/dark green, α, β, and γ of Gi/Gs in dark gray/light gray/purple, respectively, TM4/light blue, TM5/gray, α-helical αiAH/green, and αsAH/yellow. g MD simulations could not be performed for open conformations of αsAH and αiAH due to steric clash
Fig. 4
Fig. 4
Effect of interference peptides on receptor signaling. a cAMP production was determined in HEK-293 T cells transfected with 0.4 μg of A1R and A2AR cDNAs. Cells were treated for 4 h with medium (control) or with 4 μM A2AR TM synthetic peptides (TM1 to TM7, see Methods). Cells were unstimulated (basal, dotted line) or stimulated with forskolin (Fk, 0.5 μM, gray bars), with forskolin and the A1R agonist CPA (100 nM, black bars), the A2AR agonist CGS-21680 (100 nM, white bars), or with CPA and CGS-21680 (striped bars). Increases in cAMP percentage accumulation in relation to unstimulated cells. Mean ± SEM (7 experiments/condition). One-way ANOVA followed by Bonferroni’s post-hoc test showed a significant effect over basal in samples treated with CGS-21680 or CGS-21680 plus CPA, or over forskolin in samples treated with CPA (*P < 0.05, **P < 0.01, ***P < 0.001). One-way ANOVA followed by Bonferroni’s post-hoc test showed a significant effect over control in the absence of peptide (&P < 0.05, &&P < 0.01). b Intermolecular distances (depicted as double arrows in the adjacent schematic representation) were obtained from MD simulations of A1-A2AHet in complex with Gi and GsiAH and αsAH were modeled in the open conformation, see Additional file 1: Figure S2B) in the presence of the TAT-fused TM6 peptide, which alters the heteromer interface between A1R and A2AR. A representative snapshot of the molecular model is shown, viewed from the intracellular site. The TAT-TM6 peptide is shown in purple, whereas the color code of the depicted proteins is as in Fig. 3
Fig. 5
Fig. 5
A1-A2AHet as an adenosine concentration-sensing device. A1-A2AHet-expressed cells were treated for 4 h with medium (a) or with 4 μM of the synthetic A2AR TM6 peptide (b). Cells were stimulated with forskolin (Fk, 0.5 μM, red broken line) and adenosine at increasing concentrations (30–3000 nM, black bars). cAMP levels were expressed as percentage over unstimulated cells (basal, 100%). Mean ± SEM of (7 experiments/condition). One-way ANOVA followed by a Dunnett’s multiple comparison tests showed statistical differences relative to cells stimulated only with forskolin (**P < 0.01, ***P < 0.001). Bottom panels show schemes that may provide an explanation of the results obtained at each adenosine concentration. (1) The higher affinity of adenosine for A1R than for A2AR is illustrated by the size of the black lines at the binding site (adenosine is shown as gray rectangles). (2) Adenosine-induced A1R and A2AR activation are depicted as arrows in pink and green, respectively, starting at the binding site of each receptor. (3) A1R-induced Gi activation and A2AR-induced Gs activation, with the corresponding decrease/increase of cAMP, are depicted as arrows in pink and green, respectively. The inhibitory effect of Gs on Gi-mediated signaling is shown as a red arrow. Width of arrows illustrates the magnitude of receptor or G protein activation or cross-talk. High adenosine concentrations increase the A2AR binding (gray rectangle), the adenosine-induced A2AR activation, the A2AR-induced GS activation (green arrows) and the cross-talk among G proteins (red arrow), while decreasing the A1R-induced Gi activation (pink arrow) due to the cross-talk. In the presence of TM6 (in purple) the cross-talk among G proteins is lost, enabling simultaneous A1R-induced Gi activation (pink arrow) and A2AR-induced GS activation (green arrow)
Fig. 6
Fig. 6
Effect of interference peptides on recruitment of β-arrestin-2. a, b Receptor agonist-induced β-arrestin-2 recruitment was measured by BRET. HEK-293 T cells were transfected with the cDNAs for β-arrestin-2-Rluc (Arr-Rluc, 0.5 μg cDNA) and either A2A-YFP (0.4 μg cDNA) and A1R (0.4 μg cDNA) (a) or A1-YFP (0.4 μg cDNA) and A2AR (0.4 μg cDNA) (b). Cells were untreated (control) or treated for 4 h with 4 μM A2AR TAT-TM synthetic peptides (TM4–7, see Methods) before addition of medium (basal, gray bars) or 100 nM of either the A1R agonist CPA (black bars), the A2AR agonist CGS-21680 (CGS, white bars), or both (striped bars). Positive BRET was expressed as milli-BRET units (see Methods). Mean ± SEM (7 experiments/condition). One-way ANOVA followed by Bonferroni’s post-hoc test showed a significant effect over basal in samples treated with CGS-21680 or over forskolin in samples treated with CPA (*P < 0.05, **P < 0.01, ***P < 0.001). One-way ANOVA followed by Bonferroni’s post-hoc test showed a significant effect of CPA + CGS-21680 over CGS-21680 treatments (&P < 0.05, &&P < 0.01). c Intermolecular distances between the center of masses of the N- and C-domains of the A1R-bound arrestin and of the A2AR-bound arrestin obtained from molecular dynamics (MD) simulations of A1-A2AHet in complex with two molecules of β-arrestin-2. d Intermolecular distances between the center of mass of the N- and C-domains of the A2AR-bound arrestin and the Cα atom of Glu238 (RAS domain) of Gi obtained from MD simulations of A1-A2AHet in complex with Gi bound to A1R and β-arrestin-2 bound to A2AR. These intermolecular distances are depicted as double arrows in the adjacent representative snapshots of the molecular models. Arrestin is shown in gray, whereas the color code of the depicted proteins is as in Fig. 3
Fig. 7
Fig. 7
Influence of A2AR C-terminal domain over signaling properties of A1-A2AHets. a BRET in cells expressing constant A1-Rluc amount (0.4 μg cDNA) and increasing (0.1–0.7 μg cDNA) amounts of A2AΔ40R-YFP or A2AΔCTR-YFP. Mean of milli-BRET units ± SEM (n = 7). b BiFC assays (fluorescence measured at 530 nm) were performed in cells expressing (1 μg cDNA) A1R-nYFP and A2AΔCTR-cYFP and pre-treated for 4 h with medium or 4 μM A2AR-TM peptides (TM1–7). Mean ± SEM (13 experiments/treatment). One-way ANOVA followed by a Dunnett’s multiple comparison test showed a significant fluorescence decrease over control values (***P < 0.001). c HEK-293 T cells expressing A1R (0.4 μg cDNA) and A2AR (0.3 μg cDNA), A2AΔ40R (0.3 μg cDNA), or A2AΔCTR (0.3 μg cDNA) were unstimulated (basal, dotted line) or stimulated with forskolin (Fk, 0.5 μM, gray bars), with forskolin and CPA (100 nM, black bars), CGS-21680 (CGS, 100 nM, white bars), or with CPA + CGS-21680 (striped bars). cAMP percentage accumulation over unstimulated cells. Mean ± SEM (7 experiments/group). One-way ANOVA followed by Bonferroni’s post-hoc test: significant effect over basal in CGS-21680-stimulated samples or over forskolin-stimulated cells (**P < 0.01, ***P < 0.001) or CPA + CGS-21680 over CGS-21680-stimulated cells (&&&P < 0.001). d HEK-293 T cells expressing β-arrestin-2-Rluc (Arr-Rluc, 0.5 μg cDNA), A1-YFP (0.4 μg) and A2AR (0.3 μg), A2AΔ40R (0.3 μg), or A2AΔCTR (0.3 μg). Cells stimulated with agonists as indicated. Mean ± SEM (7 experiments/condition). One-way ANOVA followed by the Bonferroni’s post-hoc test: significant differences over unstimulated cells (*P < 0.05, ***P < 0.001) or CPA-CGS-21680 over CGS-21680-stimulated cells (&P < 0.05, &&P < 0.01). e Molecular model of the A2AR homodimer in complex with Gs. TMs involved in homodimerization: TM4/light blue and TM5/gray; color code of proteins is as in Fig. 3. C-tail of Gsα-subunit-unbound A2AR protomer is near αsAH (shown in closed conformation)

References

    1. Thompson SM, Haas HL, Gahwiler BH. Comparison of the actions of adenosine at pre- and postsynaptic receptors in the rat hippocampus in vitro. J Physiol. 1992;451:347–363. doi: 10.1113/jphysiol.1992.sp019168. - DOI - PMC - PubMed
    1. Franco R, Martinez-Pinilla E, Lanciego JL, Navarro G. Basic pharmacological and structural evidence for class A G-protein-coupled receptor heteromerization. Front Pharmacol. 2016;7:76. doi: 10.3389/fphar.2016.00076. - DOI - PMC - PubMed
    1. Ferre S, Baler R, Bouvier M, Caron MG, Devi LA, Durroux T, Fuxe K, George SR, Javitch JA, Lohse MJ, et al. Building a new conceptual framework for receptor heteromers. Nat Chem Biol. 2009;5:131–134. doi: 10.1038/nchembio0309-131. - DOI - PMC - PubMed
    1. Ciruela F, Casado V, Rodrigues RJ, Lujan R, Burgueno J, Canals M, Borycz J, Rebola N, Goldberg SR, Mallol J, et al. Presynaptic control of striatal glutamatergic neurotransmission by adenosine A1-A2A receptor heteromers. J Neurosci. 2006;26:2080–2087. doi: 10.1523/JNEUROSCI.3574-05.2006. - DOI - PMC - PubMed
    1. Navarro G, Cordomi A, Zelman-Femiak M, Brugarolas M, Moreno E, Aguinaga D, Perez-Benito L, Cortes A, Casado V, Mallol J, et al. Quaternary structure of a G-protein-coupled receptor heterotetramer in complex with Gi and Gs. BMC Biol. 2016;14:26. doi: 10.1186/s12915-016-0247-4. - DOI - PMC - PubMed

Publication types

MeSH terms

Substances