. 2018 Apr 25;38(17):4065-4075.
doi: 10.1523/JNEUROSCI.3234-17.2018. Epub 2018 Feb 27.

Task Division within the Prefrontal Cortex: Distinct Neuron Populations Selectively Control Different Aspects of Aggressive Behavior via the Hypothalamus

Affiliations

Task Division within the Prefrontal Cortex: Distinct Neuron Populations Selectively Control Different Aspects of Aggressive Behavior via the Hypothalamus

Laszlo Biro et al. J Neurosci. .

Abstract

An important question in behavioral neurobiology is how particular neuron populations and pathways mediate the overall roles of brain structures. Here we investigated this issue by studying the medial prefrontal cortex (mPFC), an established locus of inhibitory control of aggression. We established in male rats that dominantly distinct mPFC neuron populations project to and produce dense fiber networks with glutamate release sites in the mediobasal hypothalamus (MBH) and lateral hypothalamus (LH; i.e., two executory centers of species-specific and violent bites, respectively). Optogenetic stimulation of mPFC terminals in MBH distinctively increased bite counts in resident/intruder conflicts, whereas the stimulation of similar terminals in LH specifically resulted in violent bites. No other behaviors were affected by stimulations. These findings show that the mPFC controls aggressiveness by behaviorally dedicated neuron populations and pathways, the roles of which may be opposite to those observed in experiments where the role of the whole mPFC (or of its major parts) has been investigated. Overall, our findings suggest that the mPFC organizes into working units that fulfill specific aspects of its wide-ranging roles.SIGNIFICANCE STATEMENT Aggression control is associated with many cognitive and emotional aspects processed by the prefrontal cortex (PFC). However, how the prefrontal cortex influences quantitative and qualitative aspects of aggressive behavior remains unclear. We demonstrated that dominantly distinct PFC neuron populations project to the mediobasal hypothalamus (MBH) and the lateral hypothalamus (LH; i.e., two executory centers of species-specific and violent bites, respectively). Stimulation of mPFC fibers in MBH distinctively increased bite counts during fighting, whereas stimulation of similar terminals in LH specifically resulted in violent bites. Overall, our results suggest a direct prefrontal control over the hypothalamus, which is involved in the modulation of quantitative and qualitative aspects of aggressive behavior through distinct prefrontohypothalamic projections.

Keywords: aggression; hypothalamus; optogenetics; prefrontal cortex; rats; social behavior.


Figures

Figure 1.
Figure 1.
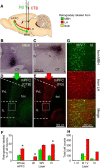
Retrograde labeling from MBH and LH reveals large, dominantly nonoverlapping populations of mPFC projection neurons. A, The schematic of the study. B, C, Representative CTB and FG injection sites in the MBH and LH, respectively. D, E, Low-magnification photomicrographs depicting CTB- and FG-labeled neurons that project to the MBH and LH, respectively. F, The share of projection neurons expressed as the percentage of the total number of neurons in the PrL and IL. The total number of neurons was assessed by NeuN staining (data not shown in the photomicrographs). G, Large-magnification photomicrographs illustrating mPFC neurons retrogradely labeled from the MBH, the LH, or both (coexpression). H, The number of neurons expressing CTB, FG, or both of the 864 that were evaluated. Note that F shows a share of labeled neurons, whereas H shows their actual numbers. Apparent discrepancies are due to layer differences in neuron density. 3V, Third ventricle; fmi, forceps minor; fx, fornix; OT, optic tract. *Significant difference between MBH and LH projections (p < 0.01).
Figure 2.
Figure 2.
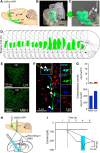
The mPFC densely innervates hypothalamic centers of attack by excitatory projections. A, The schematic of the study. B, Representative 3D reconstruction of eYFP labeling in the mPFC of one rat. C, 3D reconstruction of the LH and MBH within the hypothalamus with anatomical landmarks. D, The distribution of virus infection indicated by eYFP labeling in the mPFC of all the 18 rats investigated in resident/intruder tests. The schematics show brain sections at 3.2 mm from bregma, where labeling was most extensive. E, Confocal photomicrographs illustrating the density of prefrontal fibers in the LH and MBH. F, Confocal photomicrographs illustrating prefrontal terminals triple labeled for eYFP, vGAT, and vGLUT1. G, The average number of terminals coexpressing vGAT/eYFP and vGLUT1/eYFP in the LH and MBH. H, The schematic of in vitro electrophysiological recordings. I, Averaged PSCs evoked by photostimulation in hypothalamic neurons adjacent to eYFP-labeled terminals. Insert, Zoomed version of I showing the temporal relationship between the laser shot and the evoked PSC. Cg1, Anterior cingulate cortex; DP, dorsal peduncular cortex; fmi, forceps minor; fx, fornix; OF, the tip of the optic fiber; PVN, paraventricular nucleus of the hypothalamus; V3, third ventricle.
Figure 3.
Figure 3.
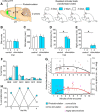
Photostimulation of mPFC afferents in the LH selectively increased the share of abnormal attacks. A, The schematic of the study. B–E, Variables that characterize biting attacks (for explanations, see legends below). F, Behaviors recorded during resident/intruder tests. Trials were shown here as contiguous columns. G, The temporal distribution of biting attacks. The presence of stimulation was indicated by the color code. Each row of vertical lines depicts bites delivered by individual rats; distance from the left-hand y-axis shows their timing. Curves are second-order polynomial fits of total bite frequencies over the encounter (see right-hand y-axis for the scale). H, Changes in the share of vulnerable bites over trials in two representative rats in which stimulation was associated with the first and third or the second and fourth trials, respectively. Please see Figure 3-1 for the location of the tips of optic fibers within the LH. Abnormal attacks, Bites not preceded by social signals or aimed at vulnerable targets (e.g., the head, throat or belly); DOM, dominant posture; EXP, exploration; GRO, grooming; highly abnormal: bites targeting vulnerable body parts of opponents without social signaling; OFF, offensive behaviors; RES, resting; SOC, social interactions. *Significant difference between stimulated and nonstimulated R/I tests (p < 0.01).
Figure 4.
Figure 4.
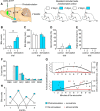
Photostimulation of mPFC afferents in the MBH selectively increased attack counts. A, The schematic of the study. B–E, Variables that characterize biting attacks. F, Behaviors recorded during resident/intruder tests. Subsequent trials were shown here as contiguous columns. G, The temporal distribution of biting attacks. H, Changes in bite counts over trials in two representative rats in which stimulation was associated with the first and third or the second and fourth trials, respectively. Please see Figure 4-1 for the location of the tips of optic fibers within the MBH. For explanations and abbreviations, see Figure 3. *Significant difference between stimulated and non-stimulated R/I tests (p < 0.01).
Figure 5.
Figure 5.
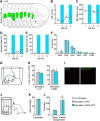
Control studies. A, The extension of virus infection in rats studied in the resident/intruder test presented here. The experiment was performed according to the schematic shown in Figure 3, but the virus carried this time the gene of the light-insensitive eYFP alone. B–F, Behaviors recorded in the four resident/intruder trials. G, Rats treated as shown in Figure 3A were photostimulated in their home cage, after which their brains were sampled and assessed for the expression of the neuronal activation marker c-Fos in the mPFC. H, I, The findings and representative photomicrographs of the c-Fos expression study. J, Rats treated as shown in Figure 3A were photostimulated in the MBH and submitted to the three-chamber sociability test. K, L, The results of the three-chamber sociability test. For explanations and abbreviations, see Figure 3. *Significant difference between stimulated and nonstimulated R/I tests (p < 0.01).

References

    1. Ago Y, Araki R, Tanaka T, Sasaga A, Nishiyama S, Takuma K, Matsuda T (2013) Role of social encounter-induced activation of prefrontal serotonergic systems in the abnormal behaviors of isolation-reared mice. Neuropsychopharmacology 38:1535–1547. 10.1038/npp.2013.52 - DOI - PMC - PubMed
    1. Bandler RJ., Jr (1970) Cholinergic synapses in the lateral hypothalamus for the control of predatory aggression in the rat. Brain Res 20:409–424. 10.1016/0006-8993(70)90171-X - DOI - PubMed
    1. Beiderbeck DI, Reber SO, Havasi A, Bredewold R, Veenema AH, Neumann ID (2012) High and abnormal forms of aggression in rats with extremes in trait anxiety—involvement of the dopamine system in the nucleus accumbens. Psychoneuroendocrinology 37:1969–1980. 10.1016/j.psyneuen.2012.04.011 - DOI - PubMed
    1. Biro L, Toth M, Sipos E, Bruzsik B, Tulogdi A, Bendahan S, Sandi C, Haller J (2017) Structural and functional alterations in the prefrontal cortex after post-weaning social isolation: relationship with species-typical and deviant aggression. Brain Struct Funct 222:1861–1875. 10.1007/s00429-016-1312-z - DOI - PubMed
    1. Blair RJ. (2015) Psychopathic traits from an RDoC perspective. Curr Opin Neurobiol 30:79–84. 10.1016/j.conb.2014.09.011 - DOI - PubMed

Publication types