. 2018 May;209(1):65-76.
doi: 10.1534/genetics.117.300627. Epub 2018 Feb 27.

Accounting for Errors in Low Coverage High-Throughput Sequencing Data When Constructing Genetic Maps Using Biparental Outcrossed Populations

Affiliations

Accounting for Errors in Low Coverage High-Throughput Sequencing Data When Constructing Genetic Maps Using Biparental Outcrossed Populations

Timothy P Bilton et al. Genetics. 2018 May.

Abstract

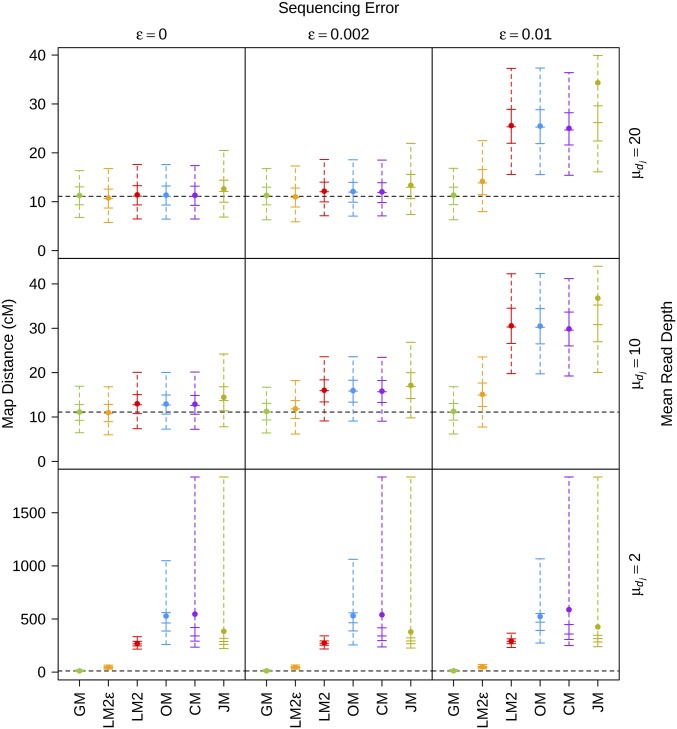
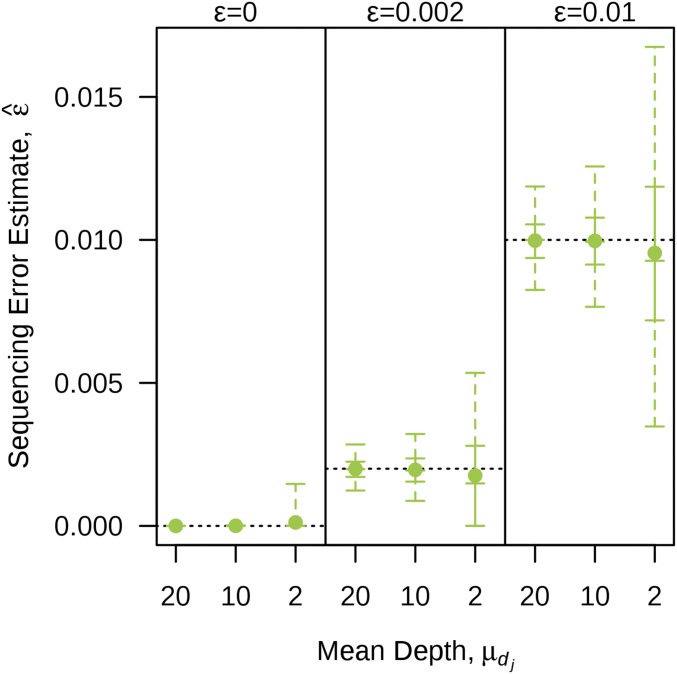
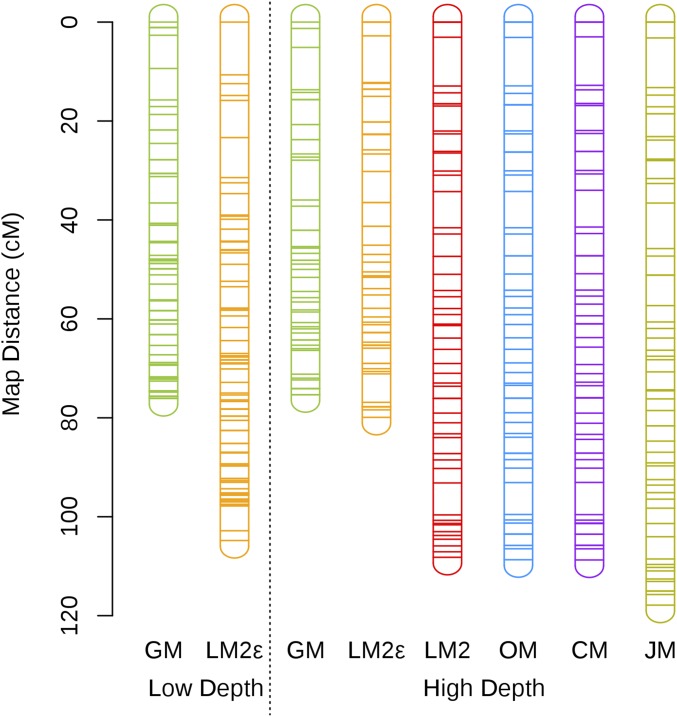
Next-generation sequencing is an efficient method that allows for substantially more markers than previous technologies, providing opportunities for building high-density genetic linkage maps, which facilitate the development of nonmodel species' genomic assemblies and the investigation of their genes. However, constructing genetic maps using data generated via high-throughput sequencing technology (e.g., genotyping-by-sequencing) is complicated by the presence of sequencing errors and genotyping errors resulting from missing parental alleles due to low sequencing depth. If unaccounted for, these errors lead to inflated genetic maps. In addition, map construction in many species is performed using full-sibling family populations derived from the outcrossing of two individuals, where unknown parental phase and varying segregation types further complicate construction. We present a new methodology for modeling low coverage sequencing data in the construction of genetic linkage maps using full-sibling populations of diploid species, implemented in a package called GUSMap. Our model is based on the Lander-Green hidden Markov model but extended to account for errors present in sequencing data. We were able to obtain accurate estimates of the recombination fractions and overall map distance using GUSMap, while most existing mapping packages produced inflated genetic maps in the presence of errors. Our results demonstrate the feasibility of using low coverage sequencing data to produce genetic maps without requiring extensive filtering of potentially erroneous genotypes, provided that the associated errors are correctly accounted for in the model.

Keywords: genetic linkage maps; genotyping-by-sequencing; hidden Markov model; map inflation; sequencing errors.


Figures

Figure 1
Figure 1
Distribution of the map distance estimates for the first set of simulations across varying mean read depths (rows) and varying sequencing error rates (columns). The solid point represents the mean; the vertical solid line represents the interquartile range; the vertical dashed line represents the range between the 2.5th and 97.5th percentiles; the five horizontal solid lines represent, in ascending order, the 2.5th percentile, lower quantile, median, upper quantile, and 97.5th percentile; and the horizontal black dotted line represents the true parameter value. Map distances are in centimorgans and were computed using the Haldane mapping function.
Figure 2
Figure 2
Distribution of sequencing error estimates obtained from GM for various combinations of mean read depths and sequencing error rates. The solid point represents the mean; the vertical solid line represents the interquartile range; the vertical dashed line represents the range between the 2.5th and 97.5th percentiles; the five horizontal solid lines represent, in ascending order, the 2.5th percentile, lower quantile, median, upper quantile, and 97.5th percentile; and the horizontal black dotted lines represent the true parameter values.
Figure 3
Figure 3
Distribution of log transformed computational time (in seconds) used on each data set across all nine simulation scenarios for the first set of simulations and each software package. The solid point represents the mean; the vertical solid line represents the interquartile range; the vertical dashed line represents the range between the 2.5th and 97.5th percentiles; and the five horizontal solid lines represent, in ascending order, the 2.5th percentile, lower quantile, median, upper quantile, and 97.5th percentile.
Figure 4
Figure 4
Sum of recombination fraction estimates mean square errors for fixed sequencing effort. Recombination fraction estimates were computed using GM, where the OPGPs was known and the sequencing effort was fixed at 10,000 reads. The parameters used to generate the data sets corresponds to the first set of simulations, with the exception that the mean depth and number of individuals were set to maintain a sequencing effort of 10,000 reads. The sum of the mean square errors was calculated using j=111MSE(r^j). The number of individuals range from 833 for a mean depth of 1 to 55, for a mean depth of 15.15.
Figure 5
Figure 5
Subset of linkage maps for SNPs on chromosome 11 of mānuka computed using the various software packages. Low depth refers to the maps produced using SNPs with a mean read depth below 6, while high depth refers to maps produced using SNPs with <20% missing data after setting genotypes with a read depth below 20 to missing. Map distances are in centimorgans and were computed using the Haldane mapping function. The rounded rectangles represent the chromosomes and the horizontal lines represent the SNPs. Different sets of SNPs are used in the low and high depth sets. See Figure S13 in File S2 for a plot of the genetic distance verses the physical distance for each these maps.

References

    1. Baird N. A., Etter P. D., Atwood T. S., Currey M. C., Shiver A. L., et al. , 2008. Rapid SNP discovery and genetic mapping using sequenced RAD markers. PLoS One 3: e3376 10.1371/journal.pone.0003376 - DOI - PMC - PubMed
    1. Baum L. E., Petrie T., Soules G., Weiss N., 1970. A maximization technique occurring in the statistical analysis of probabilistic functions of Markov chains. Ann. Math. Stat. 41: 164–171. 10.1214/aoms/1177697196 - DOI
    1. Bradbury P. J., Zhang Z., Kroon D. E., Casstevens T. M., Ramdoss Y., et al. , 2007. TASSEL: software for association mapping of complex traits in diverse samples. Bioinformatics 23: 2633–2635. 10.1093/bioinformatics/btm308 - DOI - PubMed
    1. Butcher A., Williams R., Whitaker D., Ling S., Speed P., et al. , 2002. Improving linkage analysis in outcrossed forest trees–an example from acacia mangium. Theor. Appl. Genet. 104: 1185–1191. 10.1007/s00122-001-0820-1 - DOI - PubMed
    1. Cartwright D. A., Troggio M., Velasco R., Gutin A., 2007. Genetic mapping in the presence of genotyping errors. Genetics 176: 2521–2527. 10.1534/genetics.106.063982 - DOI - PMC - PubMed

Publication types

LinkOut - more resources