. 2018 Mar;208(3):853-874.
doi: 10.1534/genetics.117.300077.

RNA Interference (RNAi) Screening in Drosophila

Affiliations

RNA Interference (RNAi) Screening in Drosophila

Florian Heigwer et al. Genetics. 2018 Mar.

Abstract

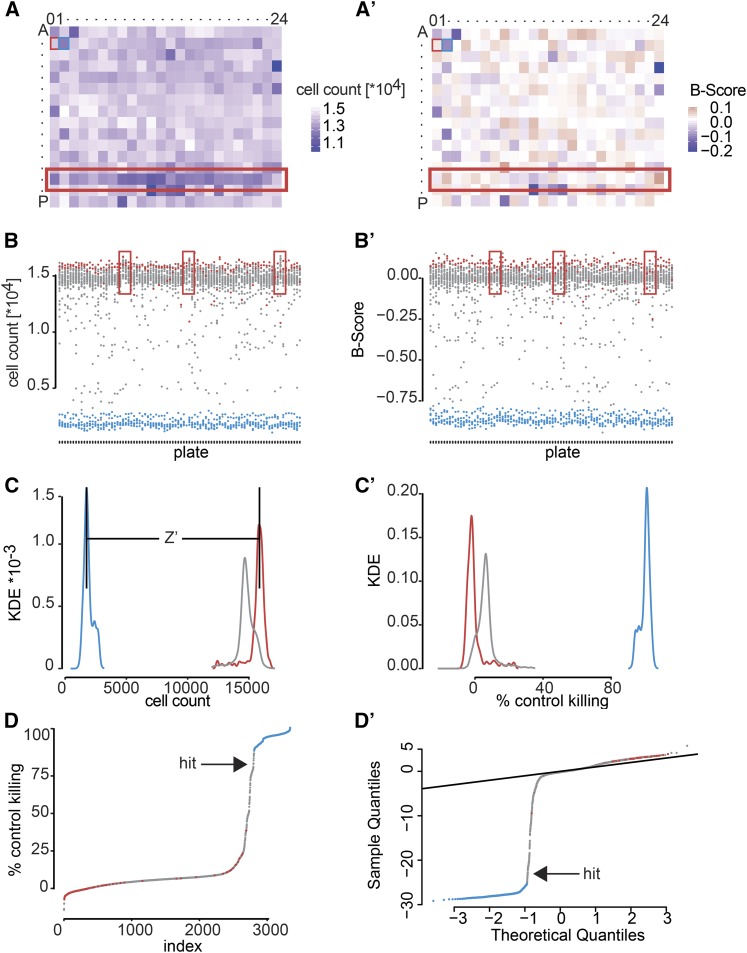
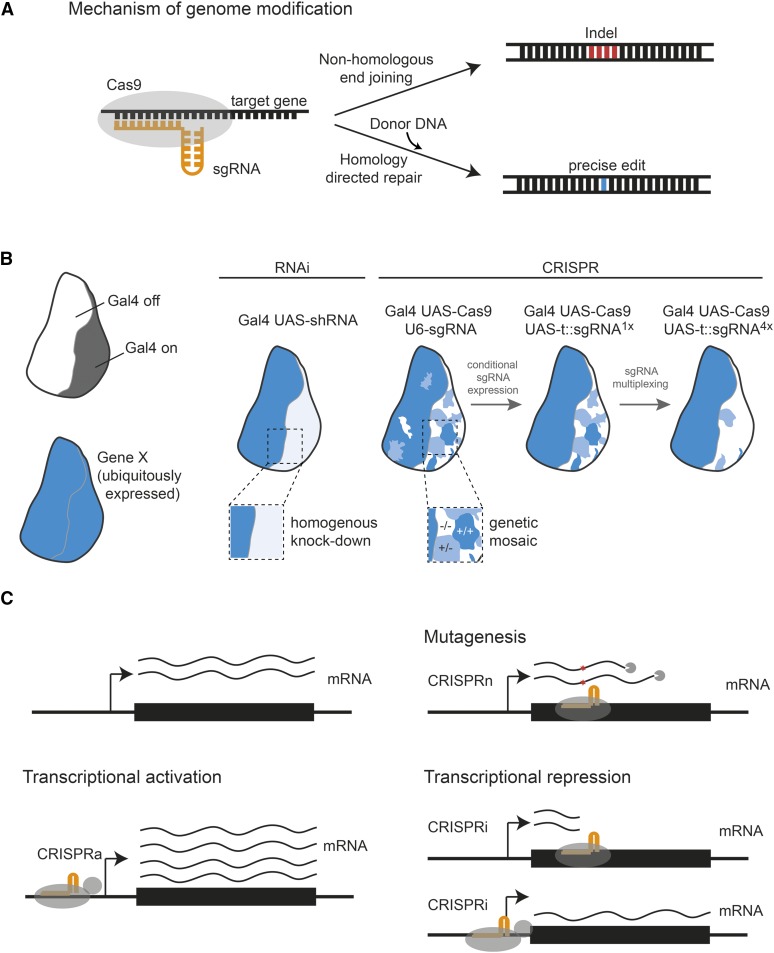
In the last decade, RNA interference (RNAi), a cellular mechanism that uses RNA-guided degradation of messenger RNA transcripts, has had an important impact on identifying and characterizing gene function. First discovered in Caenorhabditis elegans, RNAi can be used to silence the expression of genes through introduction of exogenous double-stranded RNA into cells. In Drosophila, RNAi has been applied in cultured cells or in vivo to perturb the function of single genes or to systematically probe gene function on a genome-wide scale. In this review, we will describe the use of RNAi to study gene function in Drosophila with a particular focus on high-throughput screening methods applied in cultured cells. We will discuss available reagent libraries and cell lines, methodological approaches for cell-based assays, and computational methods for the analysis of high-throughput screens. Furthermore, we will review the generation and use of genome-scale RNAi libraries for tissue-specific knockdown analysis in vivo and discuss the differences and similarities with the use of genome-engineering methods such as CRISPR/Cas9 for functional analysis.

Keywords: Drosophila; FlyBook; RNAi; bioinformatics; functional genomics; genome engineering; high-throughput screening; image-based screening.


Figures

Figure 1
Figure 1
RNAi methods. RNAi is a gene silencing method that works through degradation of homologous messenger RNAs (mRNA, orange). (A) In Drosophila cells, dsRNAs (black) are taken up by cells using “scavenger” receptor-mediated endocytosis. Each dsRNA/shRNA molecule is then processed by Dicer-2 and R2D2 (brown) into multiple ∼19-bp single-stranded siRNAs. These are incorporated into the RISC. RISC comprises the siRNA, AGO2 (green), and other accessory proteins (e.g., hsp90, blue) and binds and degrades the siRNA complementary target mRNA (red). RNAi can be induced (B) by bathing cells in aqueous dsRNA solution (C) by microinjections of dsRNA into embryos, (D) by crossing of transgenic (Gal4) driver lines to dsRNA-expressing flies (UAS-dsRNA), or (E) shRNA-expressing flies (UAS-shRNA).
Figure 2
Figure 2
A broad spectrum of phenotypes can be screened by RNAi. (A and B) Image-based analysis of cell morphology, subcellular structures, and protein localization in cultured Drosophila cell lines after knockdown of gene expression by RNAi. (A) S2 cells treated with dsRNA targeting Rho1 and skd stained for actin (red), α-tubulin (green), and DNA (blue) (Florian Heigwer and Michael Boutros, unpublished data). (B) Zhang et al. (2010) used a GFP-tagged mutant Huntingtin (Htt) fluorescent reporter construct to screen for modifiers of protein aggregate formation in S2 cells. Cells were stained against actin (red) and DNA (blue). Aggregation of the Htt-GFP reporter is shown in green, adapted from Zhang et al. (2010). (C) Fluorescently conjugated antibodies can be used to monitor protein abundance in intact cells. Friedman and Perrimon used fluorescent intensities of cells stained with an anti-phospho ERK antibody to gain quantitative information of ERK phosphorylation under different conditions, adapted from Friedman and Perrimon (2006). (D) Flow cytometry can be used to detect RNAi-induced phenotypes in cell populations, such as changes in cell cycle progression, adapted from Björklund et al. (2006). (E–H) Typical phenotypes analyzed in in vivo RNAi screens are visible morphological changes of the animal or changes in morphology or protein expression patterns in dissected tissues. Popular tissues screened in adult flies include the eye [(E) adapted from Iyer et al. (2016)] and wing [(F) Fillip Port, unpublished data, compare Port et al. (2011)]. Expression of fluorescent proteins in selected cell types allows for monitoring the effect of RNAi on cell morphology [(G) adapted from Lee et al. (2015)] or disruption of tissue homeostasis [(H) adapted from Zeng et al. (2015)].
Figure 3
Figure 3
RNAi screening workflow. dsRNA libraries synthesized by in vitro transcription (IVT) of PCR amplicons using T7 RNA polymerase. RNAs are then plated into microtiter plates, usually using liquid handling robots. Bathing or reverse transfection is performed by directly plating cells on top of spotted dsRNA. Depending on the specific experimental setup, an additional dsRNA (co-RNAi), treatment, or condition (chemogenetics) can be applied to the cells in consecutive steps. Each plate is assayed using, for example, biochemical readouts, signaling reporter assays, or microscopy to measure the resulting phenotype.
Figure 4
Figure 4
Screen analysis workflow. Analyses of RNAi screens are often carried out in five distinct steps. Data acquisition is performed using luminescence or fluorescence plate readers or by automated microscopy. Each method results in single or multiple numeric values describing the observed phenotype in each well. In a second step, measurements are assessed for traceable technical artifacts for missing values and corresponding measurements can be flagged. Next, data are normalized to correct for biases caused by position of the well or the plate. This transformation can be done using methods such as B-score normalization, linear models, or median control normalization. Normalized data can be scaled to the controls and/or its own distribution such that all variables measured for each experiment (well) are comparable. Common methods include the percent of control (PoC) or z-score normalization. In a last step, data are statistically tested and visualized. Visualizations include a Q–Q plot, a waterfall plot, or the volcano plot shown here on the left and right.
Figure 5
Figure 5
Example screening data set analysis. In this example data set, we screened for loss of viability phenotypes by genome-wide RNAi in S2 cells. Cells were reverse transfected with a genome-wide dsRNA library, arrayed on 384-well plates, and left to incubate for 4 days before cell growth was assessed by counting nuclei via microscopy. Increase of viability by knockdown of RasGAP1 and strong induction of apoptosis by knockdown of Diap1 served as negative and positive controls, respectively. (A) In this example plate, more cells have been seeded into all wells of row “N.” (A′) Such systematic errors (spatial biases) can be removed by B-score normalization. (B) Biases can also result from unequal seeding or treatment of individual plates throughout screening batches. Here, the plates marked by red rectangles count very high numbers of cells compared to other plates of the screen. (B′) B-score or median normalization can correct these errors as well. After normalization, all plates should have the same average cell count. (C) Given that all biases could be corrected, control dispersion can be assessed qualitatively by the separation of their distributions. How well the assay can separate positive and negative controls can also be quantified using Z′-factor analysis. (C′) If the controls behave as expected, all other samples can be normalized respective to the controls. Here we chose the percent of control normalization to judge how strong the viability defect of each dsRNA perturbation is, compared to the positive and negative controls. (D) A waterfall plot of ordered samples and controls or (D′) a Q–Q plot can aid in identifying hits in a screen. In a Q–Q plot, theoretical expected quantiles are plotted against measured quantiles. Every point that deviates strongly from the identity (diagonal line) can be identified as a candidate hit of this screen.
Figure 6
Figure 6
Strategies for minimizing false-positive results by off-target effects. Recent research has shown that genetic perturbations by RNAi and CRISPR are not 100% precise. Phenotypic effects resulting from reagents targeting unwanted sides in the genome are termed off-target effects (OTEs). Many strategies have been developed to minimize the risk of reporting phenotypes from off-target effects. (A) One measure to avoid OTEs is by designing reagents using specialized software that carefully assesses whether reagents possess multiple possible target sides in the targeted genome. (B) Comparing phenotypes of multiple sequence independent reagents is the most widely used method for ensuring target specificity and is state of the art in all functional RNAi and CRISPR/Cas experiments. (C) Unwanted side effects resulting from cellular or organismal reactions toward the reagent injection or transfection can be controlled via the use of nontargeting or nonsense targeting reagents. (D) Controls that require follow-up experiments include the validation of RNAi knockdown phenotypes using CRISPR/Cas-driven gene knockout and vice versa. (E) A rescue of the phenotype by an RNAi or sgRNA binding deficient overexpression construct can further increase confidence that the observed phenotype results from perturbing the gene of interest.
Figure 7
Figure 7
CRISPR/Cas genome editing approaches in Drosophila. The CRISPR/Cas9 system provides a powerful tool, complementary to RNAi, for perturbation of gene function in cells and animals. (A) When used in its naturally occurring form (CRISPR type II) Cas9 nuclease paired with chimeric tracr-crisprRNA, fused as sgRNA, can introduce double-stranded breaks in a sequence-dependent manner. Those then trigger endogenous DNA repair mechanisms such as homology directed repair (HDR) or nonhomologous end joining (NHEJ), depending on whether a suitable HDR donor template is present. (B) Transfer RNA (tRNA) interspaced sgRNA expression constructs paired with the tissue-specific UAS/Gal4 system can achieve efficient tissue-specific gene editing in vivo or multiplex sgRNA targeting of different genes. (C) Nuclease activity deficient “dead”-CAS9 (dCas9) fused to transcriptional modifiers can also be utilized to target gene promotors interfering with (CRISPRi) or activating gene transcription (CRISPRa).

Similar articles

Cited by

References

    1. Alalouf G., Hess A., Costigan M., Keene A. C., Goulas S., et al. , 2010. A genome-wide Drosophila screen for heat nociception identifies α2δ3 as an evolutionarily conserved pain gene. Cell 143: 628–638. - PMC - PubMed
    1. Alic N., Hoddinott M. P., Foley A., Slack C., Piper M. D. W., et al. , 2012. Detrimental effects of RNAi: a cautionary note on its use in Drosophila ageing studies. PLoS One 7: e45367. - PMC - PubMed
    1. Ameres S. L., Zamore P. D., 2013. Diversifying microRNA sequence and function. Nat. Rev. Mol. Cell Biol. 14: 475–488. - PubMed
    1. Arziman Z., Horn T., Boutros M., 2005. E-RNAi: a web application to design optimized RNAi constructs. Nucleic Acids Res. 33: W582–W588. - PMC - PubMed
    1. Ashton-Beaucage D., Udell C. M., Gendron P., Sahmi M., Lefrançois M., et al. , 2014. A functional screen reveals an extensive layer of transcriptional and splicing control underlying RAS/MAPK signaling in Drosophila. PLoS Biol. 12: e1001809. - PMC - PubMed

Publication types

Substances