. 2018 Mar 19;131(6):jcs212654.
doi: 10.1242/jcs.212654.

Parallel assembly of actin and tropomyosin, but not myosin II, during de novo actin filament formation in live mice

Affiliations

Parallel assembly of actin and tropomyosin, but not myosin II, during de novo actin filament formation in live mice

Andrius Masedunskas et al. J Cell Sci. .

Abstract

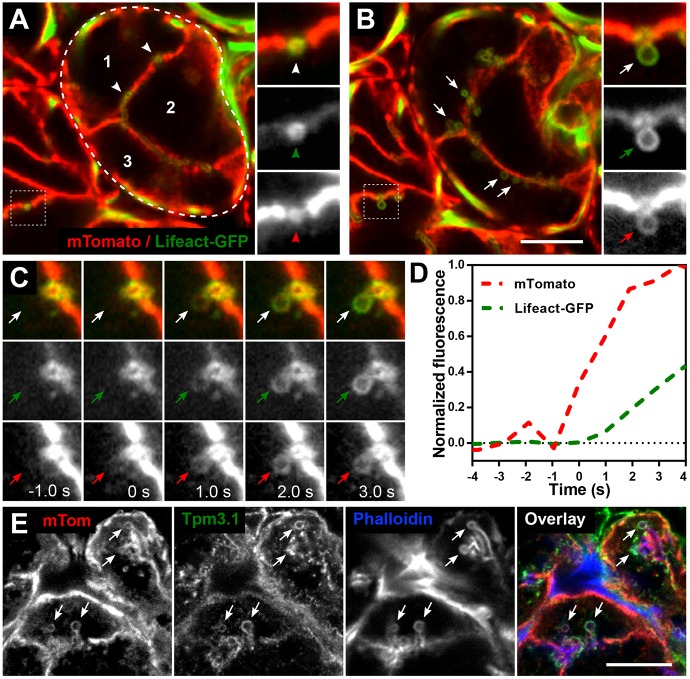
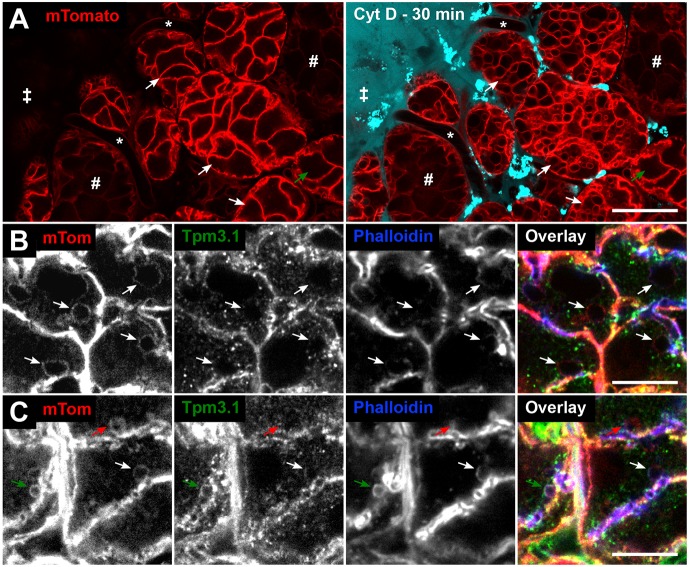
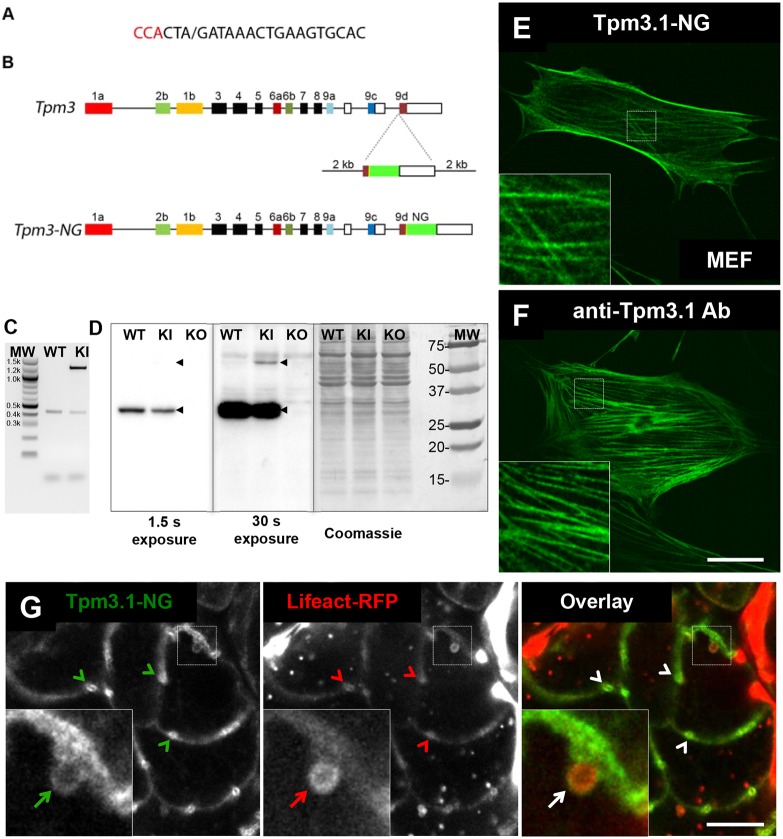
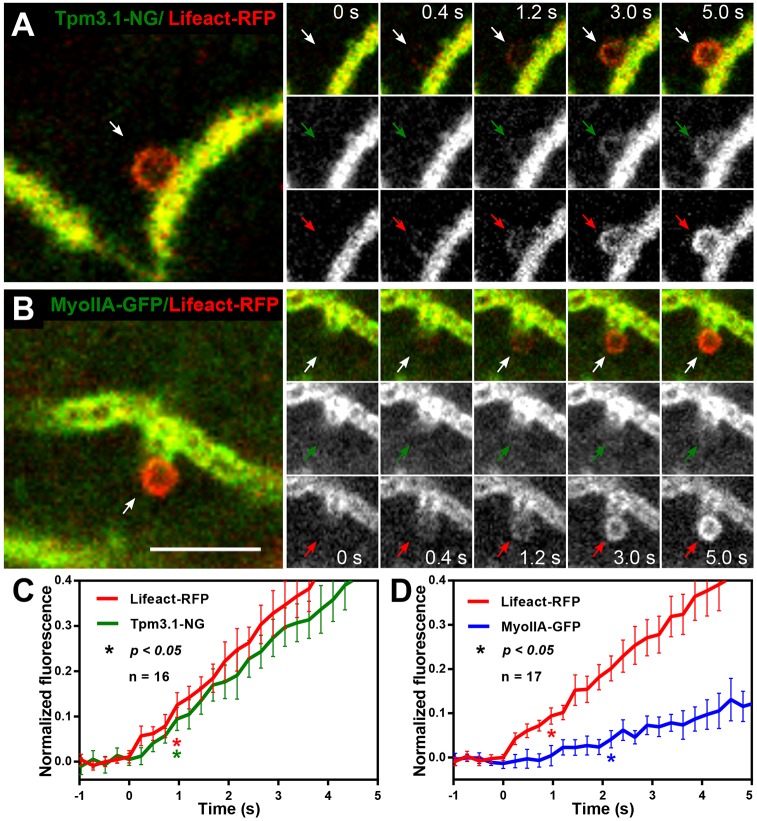
Many actin filaments in animal cells are co-polymers of actin and tropomyosin. In many cases, non-muscle myosin II associates with these co-polymers to establish a contractile network. However, the temporal relationship of these three proteins in the de novo assembly of actin filaments is not known. Intravital subcellular microscopy of secretory granule exocytosis allows the visualisation and quantification of the formation of an actin scaffold in real time, with the added advantage that it occurs in a living mammal under physiological conditions. We used this model system to investigate the de novo assembly of actin, tropomyosin Tpm3.1 (a short isoform of TPM3) and myosin IIA (the form of non-muscle myosin II with its heavy chain encoded by Myh9) on secretory granules in mouse salivary glands. Blocking actin polymerization with cytochalasin D revealed that Tpm3.1 assembly is dependent on actin assembly. We used time-lapse imaging to determine the timing of the appearance of the actin filament reporter LifeAct-RFP and of Tpm3.1-mNeonGreen on secretory granules in LifeAct-RFP transgenic, Tpm3.1-mNeonGreen and myosin IIA-GFP (GFP-tagged MYH9) knock-in mice. Our findings are consistent with the addition of tropomyosin to actin filaments shortly after the initiation of actin filament nucleation, followed by myosin IIA recruitment.

Keywords: Actin; Assembly kinetics; Cytoskeleton; Intravital; Myosin II; Tropomyosin.


Conflict of interest statement

Competing interestsThe authors declare no competing or financial interests.

Figures

Fig. 1.
Fig. 1.
De novo actin and Tpm 3.1 filament polymerisation forms a scaffold around granules after fusion with the APM. (A–D) Intravital confocal imaging of actin filament assembly during secretory granule exocytosis in submandibular salivary gland acinar cells in the progeny of an mTomato and Lifeact–GFP mouse cross. (A,B) Snapshots of salivary acini in situ showing the membrane marker mTomato (red) and F-actin marker Lifeact–GFP (green). (A) Snapshot was taken at a depth of 12 µm from the surface of the gland. Three individual acinar epithelial cells (numbers 1–3) are part of one acinus (encircled by dashed line). Actin is highly enriched at the APM/canaliculi (white arrowheads). Enlarged split channel images displayed on the right show an APM/canaliculus cross-section (red arrowhead) enriched with F-actin (green arrowhead). (B) The same area as in A was imaged 5 min after subcutaneous injection of isoproterenol. Granules fused to APM are seen (white arrows) after stimulation with isoproterenol. Enlarged split channel images show actin recruitment (green arrow) onto the fused granule as seen by the appearance of the mTomato membrane marker (red arrow). Scale bar: 10 µm; the width of the insets is 5.25 µm. See also Fig. S1 and Movie 1. (C) Enlarged time-course images of a representative granule fusion event. The granule acquires an mTomato signal at t=0 s, marking the fusion event (red arrows), and Lifeact–GFP is first detected around the granule circumference at t=1 s (green arrows). Each panel is 5.25 µm wide and the granule diameter is ∼1.2 µm; temporal sampling is 943 ms per frame. (D) Recruitment profiles of mTomato and Lifeact–GFP during a granule fusion event are shown as normalised fluorescence intensity over time. Increase in mTomato (red line) signal from baseline indicates fusion between the granule membrane and the APM. Increase in Lifeact–GFP (green line) indicates actin filament assembly. The frame before the first detection of actin polymerisation was set at t=0 s for this and all subsequent graphs. (E) Detection of mTomato, Tpm3.1 and actin (phalloidin) on fused granules (arrows) in a fixed salivary gland section from an mTomato mouse at 10 min after isoproterenol injection. The contrast was adjusted for each channel separately to facilitate consistent visualisation of the granules in all figures. Scale bar: 10 µm.
Fig. 2.
Fig. 2.
Tpm3.1 recruitment onto fused granules is dependent on actin filaments. (A) Overview of intravital imaging of cytochalasin D (CytD) treatment of salivary glands in mTomato mice [stroma (‡), intact capillaries (*), ducts (#)]. Snapshots of glands before (left) and 30 min after (right) CytD treatment. The drug solution contained 10 kDa Alexa Fluor 647 dextran (cyan). CytD treatment for 30 min results in the formation of large vacuoles in acini (white arrows indicate the same acini pre- and post-CytD). CytD penetrance is not uniform, as shown by an unaffected acinus (green arrow) further from the edge of the organ. Enrichment of bright dextran puncta represent rapid dextran marker uptake by the resident stromal cells, such as dendritic cells and fibroblasts. Scale bar: 20 µm. (B,C) Detection of mTomato, Tpm3.1 and actin (phalloidin) on fused granules (arrows) in a salivary gland section of an mTomato mouse treated with CytD (10 min), followed by isoproterenol injection (10 min). (B) CytD-affected granules are enlarged (arrows) and largely devoid of both Tpm3.1 and F-actin staining. (C) The impact of CytD is variable, with some granules exhibiting full (red arrow) or no (green arrow) impact on the actin scaffold. The white arrow shows a fused granule with partial recruitment (crescent-like patch) of F-actin and Tpm3.1. Scale bars: 10 µm.
Fig. 3.
Fig. 3.
Generation of Tpm3.1–mNeonGreen KI mouse. (A,B) The design strategy used to create fluorescently tagged KI mice via CRISPR. (A) Guide RNA used with the PAM site in red and the cut site marked with ‘/’. (B) Structure of the Tpm3 gene. (C) Agarose gel showing PCR products using DNA extracted from WT and hemizygous KI mice as a template. (D) Western blots from MEF cells isolated from WT, Tpm3.1–NG KI and Tpm3.1 KO mice. The major product is detected by anti-Tpm3.1 antibody at ∼30 kDa in WT and KI lanes, and not in the KO lane. The KI product of ∼57 kDa is only detected after 30 s exposure. Wild-type and fusion protein Tpm3.1 bands are indicated with black arrowheads. Coomassie staining was used as a loading control (right panel). Molecular mass standards (MW) are shown in kDa. (E,F) MEF cells from Tpm3.1-NG KI and WT mice. (E) Confocal image of Tpm3.1–NG localised to stress fibres (inset) in Tpm3.1–NG KI MEF cells. (F) Confocal image of Tpm3.1 localised to stress fibres (inset) in WT MEF cells detected by anti-Tpm3.1 antibody. Scale bar: 20 µm. (G) Snapshot of a single acinus from the progeny of a Tpm3.1–NG mouse crossed with a Lifeact–RFP mouse, imaged with intravital confocal microscopy after injection of isoproterenol. Cortical distribution and enrichment of Tpm3.1–NG (green) and actin filaments marked by Lifeact (red) at APM/canaliculi is evident (arrowheads). The inset shows a fused granule (white arrow) that is enveloped by an F-actin scaffold (red arrow) containing Tpm3.1 filaments (green arrow). Scale bar: 10 µm; the width of the insets is 6.5 µm.
Fig. 4.
Fig. 4.
The initial actin and Tpm3.1 filament assembly exhibits a close temporal relationship, unlike what is seen with myosin IIA. (A) Live intravital confocal imaging of de novo cytoskeleton assembly after isoproterenol-stimulated secretory granule fusion in the progeny of a Tpm3.1–NG KI and Lifeact-RFP mouse cross. The snapshot (left) shows a fused secretory granule (white arrow) near the APM/canaliculus. The image sequence (right) shows the progression of Tpm3.1–NG (green arrows) and Lifeact–RFP (red arrows) localisation over time. See also Movie 2. (B) Snapshot of intravital confocal imaged salivary acini in situ in the progeny of a myosin IIA–GFP KI and Lifeact–RFP mouse cross (left) after isoproterenol injection. Time-lapse sequence (right) showing the progression of actomyosin scaffold assembly around the granule with F-actin (red arrows) and myosin IIA (green arrows) localisation over time. See also Movie 3. (C) Recruitment kinetics of Lifeact–RFP and Tpm3.1–NG acquired at 241 ms intervals shown as mean normalised fluorescence ±95% CI for each time point. An average of 16 fusion events from four mice were plotted. The first significant (P<0.05) increase in fluorescence intensity versus the zero time point was determined by one-way ANOVA and Dunnett's multiple comparison test for Lifeact–RFP (red asterisk, P=0.0025) and Tpm3.1–NG (green asterisk, P=0.0215). (D) Recruitment kinetics of Lifeact–RFP (red line) and myosin IIA (blue line) acquired at 241 ms intervals are shown as normalised mean fluorescence intensities±95% CI from 17 fusion events in four mice. The first significant (P<0.05) increase in fluorescence intensity versus the zero time point was determined, as in Fig. 4C, for Lifeact–RFP (red asterisk, P=0.0283) and myosin IIA (blue asterisk, P=0.0091). Scale bar: 5 µm; the width of the insets is 6.16 µm.

References

    1. Alioto S. L., Garabedian M. V., Bellavance D. R. and Goode B. L. (2016). Tropomyosin and profilin cooperate to promote formin-mediated actin nucleation and drive yeast actin cable assembly. Curr. Biol. 26, 3230-3237. 10.1016/j.cub.2016.09.053 - DOI - PMC - PubMed
    1. Appaduray M. A., Masedunskas A., Bryce N. S., Lucas C. A., Warren S. C., Timpson P., Stear J. H., Gunning P. W. and Hardeman E. C. (2016). Recruitment kinetics of tropomyosin Tpm3.1 to actin filament bundles in the cytoskeleton is independent of actin filament kinetics. PLoS ONE 11, e0168203 10.1371/journal.pone.0168203 - DOI - PMC - PubMed
    1. Bovellan M., Romeo Y., Biro M., Boden A., Chugh P., Yonis A., Vaghela M., Fritzsche M., Moulding D., Thorogate R. et al. (2014). Cellular control of cortical actin nucleation. Curr. Biol. 24, 1628-1635. 10.1016/j.cub.2014.05.069 - DOI - PMC - PubMed
    1. Bryce N. S., Schevzov G., Ferguson V., Percival J. M., Lin J. J., Matsumura F., Bamburg J. R., Jeffrey P. L., Hardeman E. C., Gunning P. et al. (2003). Specification of actin filament function and molecular composition by tropomyosin isoforms. Mol. Biol. Cell 14, 1002-1016. 10.1091/mbc.E02-04-0244 - DOI - PMC - PubMed
    1. Christensen J. R., Hocky G. M., Homa K. E., Morganthaler A. N., Hitchcock-DeGregori S. E., Voth G. A. and Kovar D. R. (2017). Competition between Tropomyosin, Fimbrin, and ADF/Cofilin drives their sorting to distinct actin filament networks. eLife 6, e23152 10.7554/eLife.23152 - DOI - PMC - PubMed

Publication types

LinkOut - more resources