. 2018 Mar 13;115(11):E2644-E2652.
doi: 10.1073/pnas.1716531115. Epub 2018 Feb 27.

Target selectivity of septal cholinergic neurons in the medial and lateral entorhinal cortex

Affiliations

Target selectivity of septal cholinergic neurons in the medial and lateral entorhinal cortex

Srinidhi Desikan et al. Proc Natl Acad Sci U S A. .

Abstract

The entorhinal cortex (EC) plays a pivotal role in processing and conveying spatial information to the hippocampus. It has long been known that EC neurons are modulated by cholinergic input from the medial septum. However, little is known as to how synaptic release of acetylcholine affects the different cell types in EC. Here we combined optogenetics and patch-clamp recordings to study the effect of cholinergic axon stimulation on distinct neurons in EC. We found dense cholinergic innervations that terminate in layer I and II (LI and LII). Light-activated stimulation of septal cholinergic projections revealed differential responses in excitatory and inhibitory neurons in LI and LII of both medial and lateral EC. We observed depolarizing responses mediated by nicotinic and muscarinic receptors primarily in putative serotonin receptor (p5HT3R)-expressing interneurons. Hyperpolarizing muscarinic receptor-mediated responses were found predominantly in excitatory cells. Additionally, some excitatory as well as a higher fraction of inhibitory neurons received mono- and/or polysynaptic GABAergic inputs, revealing that medial septum cholinergic neurons have the capacity to corelease GABA alongside acetylcholine. Notably, the synaptic effects of acetylcholine were similar in neurons of both medial and lateral EC. Taken together, our findings demonstrate that EC activity may be differentially modulated via the activation or the suppression of distinct subsets of LI and LII neurons by the septal cholinergic system.

Keywords: medial septum; muscarinic receptor; neurotransmitter corelease; nicotinic receptor; optogenetics.


Conflict of interest statement

The authors declare no conflict of interest.

Figures
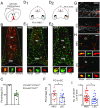
Fig. 1.
Fig. 1.
MS/DBB cholinergic neurons project to EC. (A) Schematic representation indicating the injection site (red) in MS/DBB of a ChATCre mouse for anterograde tracing experiments with AAV-DIO-ChR2-mCherry. (B) Maximum intensity confocal image showing selective expression of ChR2-mCherry in ChAT-expressing neurons upon stereotaxic virus injection into MS/DBB. Higher magnification of a representative mCherry+/ChAT+ cell from the boxed area is shown below. (C) Percentage of double+ cells relative to mCherry (gray) and ChAT (green) expression (n = 12 slices from 4 mice). (D) Schematic representation of a horizontal section indicating the unilateral injection site into MEC (D1, blue) and LEC (D2, orange) for retrograde FG (0.5%) tracing experiments. (E) Maximum intensity confocal image of MS/DBB showing retrograde FG labeling in ChAT-expressing neurons injected unilaterally in MEC (E1) and LEC (E2). Higher magnification of a representative FG+ and ChAT+ cell is shown as below. (F) Percentage of double+ cells relative to ChAT expressions after unilateral injection of the retrograde tracer FG into MEC (red; n = 14 slices from 5 mice) and LEC (blue; n = 15 slices from 6 mice). (G) Confocal images showing mCherry+ axonal projections in superficial layers of MEC (Top) and LEC (Bottom). Red dashed lines indicate the border between LI and LII as ascertained based on DAPI staining. (H) vAChT punctae are localized within mCherry+ cholinergic axons in MEC (Top) and LEC (Bottom). Images below show higher magnification of the boxed areas. (I) Number of vAChT punctae per micrometer of axon length is shown for MEC (red; n = 32 axon segments from 5 mice) and LEC (blue; n = 20 axon segments from 4 mice). Error bars indicate mean ± SEM. *P < 0.05. [Scale bars: (B and E) 150 µm, (G) 50 µm, and (H) 10 µm.]
Fig. 2.
Fig. 2.
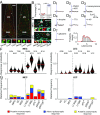
MS/DBB cholinergic neurons elicit nicotinic receptor-mediated responses in interneurons of EC. (A1) Representative average current trace of a cell held at −70 mV showing nAChR-mediated EPSC upon single 5-ms LED stimulation. (A2) Response was not blocked by glutamatergic receptor antagonists (CNQX/d-AP5; n = 12/12) (A3) but was completely blocked by a nonselective nAChR antagonist (mecamylamine; n = 12/12). Baselines and LED stimulations are indicated by red dashed lines and blue lines, respectively. (B) Box and jittered-dot plots showing the latency and peak amplitude (on a logarithmic scale) of EPSCs elicited in all responding cells in MEC (red) and LEC (blue). (C) Cell type-specific responses in MEC (Left) and LEC (Right) are depicted as violin plots that reflect the number of sampled cells of a given cell type and the number of responding cells within that group of cells (for details, see SI Materials and Methods). Red lines indicate the median of the distribution. Vertical dashed line in each plot segregates excitatory (Left) from inhibitory (Right) cell types. Numbers above the violin plots denote responding and patched cells for every cell type.
Fig. 3.
Fig. 3.
MS/DBB cholinergic neurons evoke hyperpolarizing or depolarizing muscarinic receptor-mediated responses in a cell type-specific fashion. (A) Representative average current traces (gray) of cells held at −50 mV showing mAChR-mediated hyperpolarizing (A1, Left), depolarizing (A2, Left), and biphasic (A3) response upon ten 5-ms LED stimulations at 5 Hz. In black, Savitzky–Golay-filtered data are shown. Baselines and LED stimulations are indicated by red dashed lines and blue lines, respectively. (A1, Right; A2, Right) Responses were completely blocked by a nonselective mAChR antagonist (atropine; n = 8/8 and 7/7, respectively). (B) Box and jittered-dot plots depicting the latency to peak and peak amplitude (on a logarithmic scale) of currents elicited by all MEC (red) and LEC (blue) cells that show either (B1) a hyperpolarizing response or (B2) a depolarizing response. (C and D) Cell type-specific responses are depicted as violin plots that reflect the number of sampled cells of a given cell type and the number of responding cells within that group of cells (for details, see SI Materials and Methods). The violin plots indicate the response probability for all target cells in superficial layers of MEC (Left) and LEC (Right) that show (C) a hyperpolarizing response and (D) a depolarizing response. Red lines indicate the median of the distribution. Vertical dashed line in each plot segregates excitatory (Left) from inhibitory (Right) cell types. Numbers above the violin plots denote responding and patched cells for every cell type.
Fig. 4.
Fig. 4.
MS/DBB cholinergic neurons elicit GABAAR-mediated responses in EC neurons. (A) Maximum intensity confocal images of fluorescence in situ hybridization showing expression of Gad1/Gad2 (Left/Right) and ChAT mRNA in MS/DBB neurons. Higher magnification images of the boxed areas below show ChAT+ cells that do not express Gad1 but express Gad2. (B) Percentage of ChAT+ cells that are Gad1+/Gad2+ in MS/DBB (n = 4 slices from 2 mice). (C) vGAT punctae colocalizing with vAChT punctae inside mCherry+ axonal termini in MEC (Top) and LEC (Bottom). Images below show higher magnification of the boxed areas. (D1) Representative average current traces of a cell held at −50 mV showing GABAAR-mediated IPSCs upon single 5-ms LED stimulation. (D2D4) Response was not blocked by CNQX/d-AP5, mecamylamine, and/or atropine but was blocked by application of the GABAAR antagonist (gabazine, n = 21/21). In six cells, monosynaptic inputs were tested before gabazine application: (D5) First, the response was abolished by the voltage-gated sodium channel blocker (TTX) and (D6) subsequently revived by the voltage-gated potassium channel blocker (4-AP). (D7) The recovered response was again fully blocked by gabazine (n = 5/5). Baselines and LED stimulations are indicated by red dashed lines and blue lines, respectively. (E) Histogram of the response latency with a bimodal behavior is shown. Red line is a fit of two weighted Gaussian distributions, which come close to the data. (F) Cell type-specific responses in MEC (Left) and LEC (Right) are depicted as violin plots that reflect the number of sampled cells of a given cell type and the number of responding cells within that group of cells (for details, see SI Materials and Methods). Red lines indicate the median of the distribution. Vertical dashed line in each plot segregates excitatory (Left) from inhibitory (Right) cell types. Numbers above the violin plots denote responding and patched cells for every cell type. (G) The relative frequencies of putative mono- (red), mono-/poly- (blue), and putative polysynaptic (yellow) GABAAR-mediated responses, estimated from the latencies of the responses obtained from D1 experimental conditions, are shown by stacked bar graphs for all cell types in MEC (Left) and LEC (Right). Error bars indicate mean ± SEM. ***P ≤ 0.0001. [Scale bars: (A) 150 µm and (C) 10 µm.]
Fig. 5.
Fig. 5.
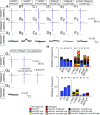
EC neurons exhibit different receptor-mediated response combinations. (AF) Combinations of nAChR-, GABAAR-, and hyperpolarizing and depolarizing mAChR-mediated responses. Every column depicts measurements from a single cell (A and F—p5HT3R+ interneuron; B—MFC; C—pPV+ interneuron; D—SC; E—LI SBC). Representative average current traces of (A1F1) nicotinic (cells held at −70 mV), (A2F2) GABAergic (cells held at −50 mV), and (A3F3) hyperpolarizing or depolarizing muscarinic responses (cells held at −50 mV). In A3F3, Savitzky–Golay filtered data are shown in black. In A3, C3, E3, and F3, note the individual time-locked EPSCs/IPSCs (seen in overlaid gray traces) corresponding to nAChR/GABAAR-mediated responses. Baselines and LED stimulations are indicated by red dashed lines and blue lines, respectively. (G) Representative average current traces of a cell, in which nAChR responses (recorded at −70 mV) and GABAAR-mediated responses (recorded at −50 mV) are elicited. This cell was identified as a p5HT3R+ interneuron. (G1) The nAChR-mediated response is not blocked by atropine but is completely blocked by mecamylamine. (G2) The GABAAR-mediated response is blocked neither by atropine nor by mecamylamine but is blocked by gabazine. (H) Stacked bar graphs depicting the relative response frequency of individual cell types, in which either a single response or combinations of responses in superficial neurons of MEC (Top) and LEC (Bottom) was detected. The number of patched cells for every cell type is mentioned above. GABAAR-mediated responses include both mono- and polysynaptic responses. Responses are specified based on the receptors mediating the corresponding currents. mAChR-dep, depolarizing mAChR-mediated response; mAChR-hyp, hyperpolarizing mAChR-mediated response.

Similar articles

Cited by

References

    1. Steward O. Topographic organization of the projections from the entorhinal area to the hippocampal formation of the rat. J Comp Neurol. 1976;167:285–314. - PubMed
    1. Witter MP, Groenewegen HJ, Lopes da Silva FH, Lohman AHM. Functional organization of the extrinsic and intrinsic circuitry of the parahippocampal region. Prog Neurobiol. 1989;33:161–253. - PubMed
    1. Witter MP, Wouterlood FG, Naber PA, Van Haeften T. Anatomical organization of the parahippocampal-hippocampal network. Ann N Y Acad Sci. 2000;911:1–24. - PubMed
    1. Kerr KM, Agster KL, Furtak SC, Burwell RD. Functional neuroanatomy of the parahippocampal region: The lateral and medial entorhinal areas. Hippocampus. 2007;17:697–708. - PubMed
    1. Canto CB, Wouterlood FG, Witter MP. What does the anatomical organization of the entorhinal cortex tell us? Neural Plast. 2008;2008:381243. - PMC - PubMed

Publication types

LinkOut - more resources