. 2018 Feb 27;9(1):849.
doi: 10.1038/s41467-018-03125-y.

Opponent control of behavioral reinforcement by inhibitory and excitatory projections from the ventral pallidum

Affiliations

Opponent control of behavioral reinforcement by inhibitory and excitatory projections from the ventral pallidum

Lauren Faget et al. Nat Commun. .

Abstract

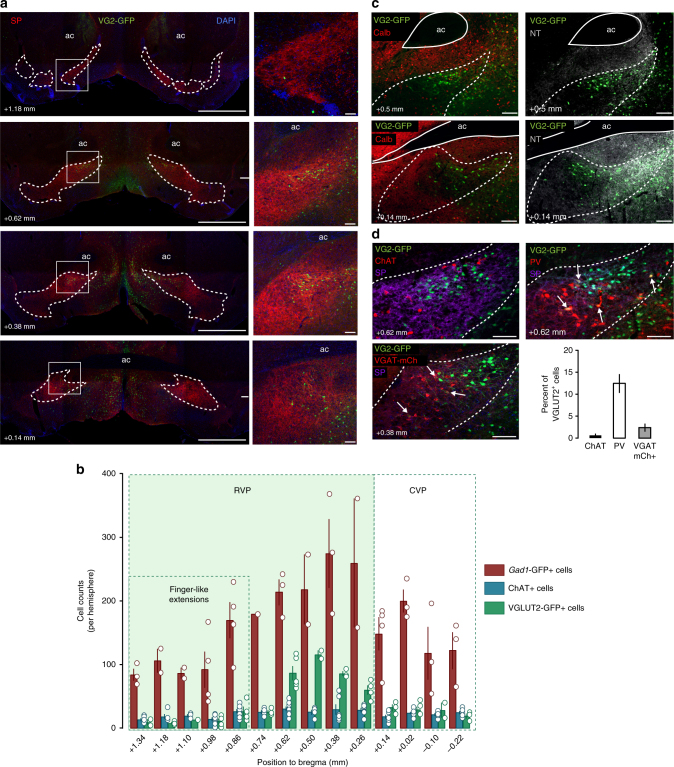
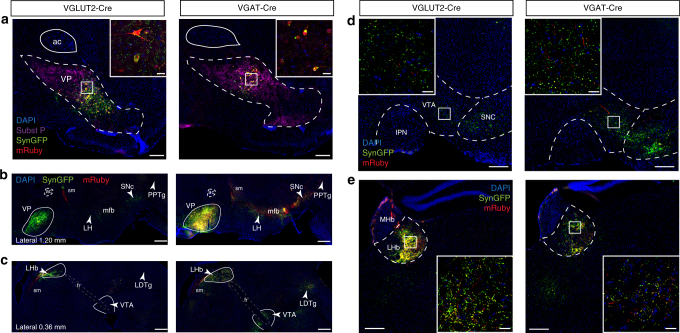
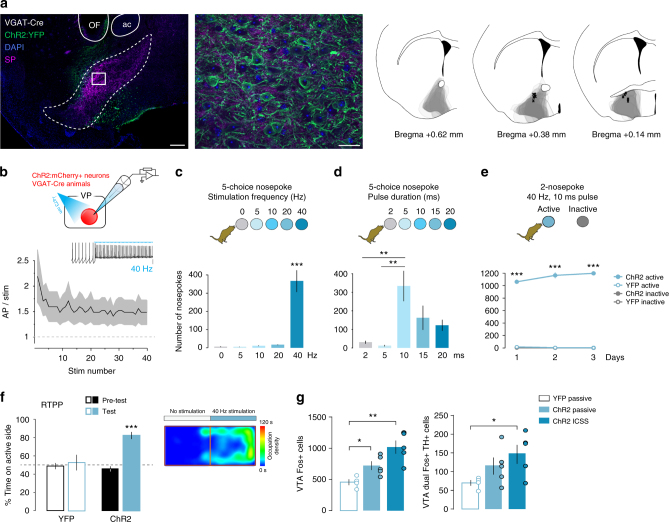
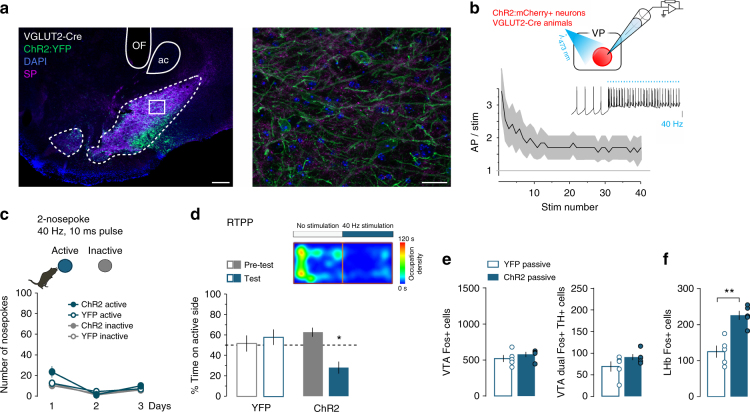
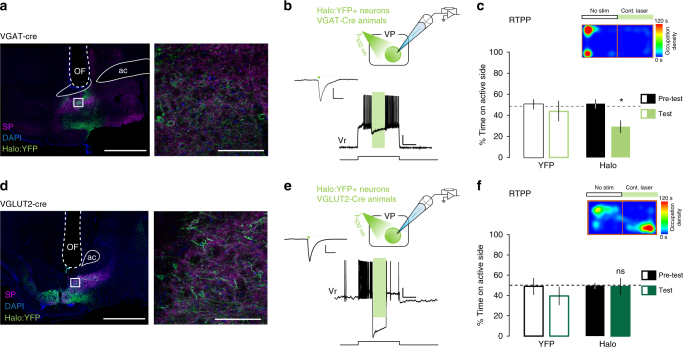
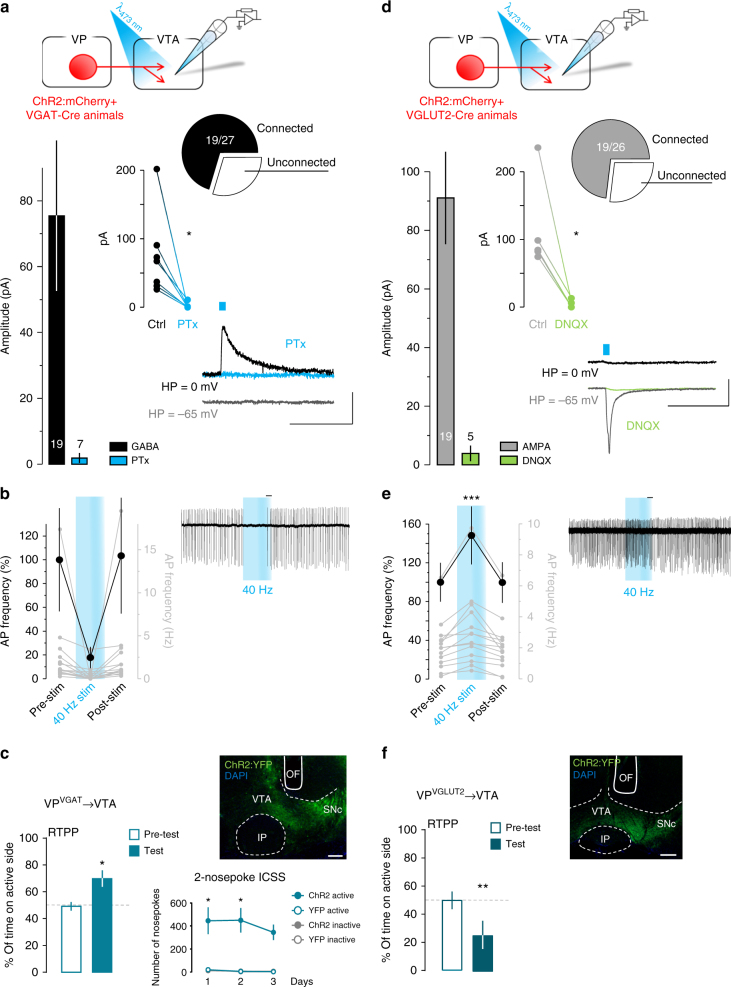
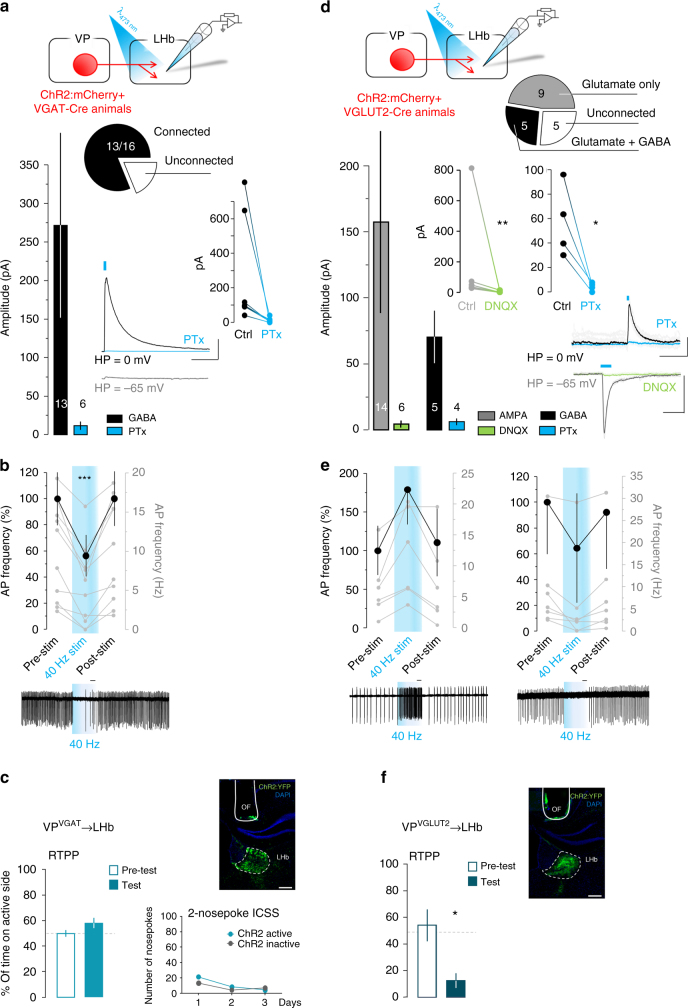
The ventral pallidum (VP) lies at the interface between sensory, motor, and cognitive processing-with a particular role in mounting behavioral responses to rewards. Though the VP is predominantly GABAergic, glutamate neurons were recently identified, though their relative abundances and respective roles are unknown. Here, we show that VP glutamate neurons are concentrated in the rostral ventromedial VP and project to qualitatively similar targets as do VP GABA neurons. At the functional level, we used optogenetics to show that activity in VP GABA neurons can drive positive reinforcement, particularly through projections to the ventral tegmental area (VTA). On the other hand, activation of VP glutamate neurons leads to behavioral avoidance, particularly through projections to the lateral habenula. These findings highlight cell-type and projection-target specific roles for VP neurons in behavioral reinforcement, dysregulation of which could contribute to the emergence of negative symptoms associated with drug addiction and other neuropsychiatric disease.


Conflict of interest statement

The authors declare no competing financial interests.

Figures

Fig. 1
Fig. 1
Localization and histochemical characterization of VP glutamate neurons. a Coronal images through the rostro-caudal axis of the VP of VGLUT2-GFP (VG2-GFP; green) reporter mice. b VGLUT2+ neurons were observed throughout the rostro-caudal axis but most abundant in centro-rostral VP (1791 VGLUT2+ cells, 44 sections, five mice). Gad1-GFP mice were used to assess GABA neurons (6196 Gad1-GFP+ cells, 39 sections, four mice) and all sections were stained and assessed for the cholinergic marker ChAT (1901 ChAT+ cells, 83 sections,nine mice). c Identification of the dorso-lateral subregion of the VP (VPdl) using antibodies directed against Calbindin (Calb), and the ventromedial subregion (VPvm) using antibodies directed against neurotensin (NT) show the densest cluster of VGLUT2+ cells in the VPvm. d Co-localization of VGLUT2+ cells with ChAT (1078 VGLUT2+ cells, eight VGLUT2+ ChAT+ cells, 36 sections, three mice), Parvalbumin (PV) (1692 VGLUT2+ cells, 200 VGLUT2+ PV+ cells, 44 sections, four mice), or VGAT (820 VGLUT2+ cells, 19 VGLUT2+ VGAT mCh+ cells, 16 sections, three mice). Substance P (SP) was used to delimitate VP boundaries in a and d, DAPI nuclear stain is shown in a, all distances are relative to Bregma, and cell counts or percent of VGLUT2+ cells expressed as mean ± SEM. Scale = 1 mm (a; left panels) and 100 µm (a; right panels, c and d). See also Supplementary Figure 1
Fig. 2
Fig. 2
Projections of VP glutamate and GABA neurons. a Coronal section showing expression of cytosolic mRuby and Synaptophysin:GFP in VP glutamate and GABA neurons using VGLUT2-Cre or VGAT-Cre mouse lines. bc Sagittal sections showing VP glutamate and GABA neurons project to similar targets throughout the brain including lateral hypothalamus (LH), ventral tegmental area (VTA), substantia nigra pars compacta (SNc), lateral habenula (LHb), pedunculopontine nucleus (PPTg), and laterodorsal tegmental nucleus (LDTg) as seen in sagittal sections from two different lateral coordinates. The anterior commissure (ac) and fasciculus retroflexus (fr)—habenulointerpeduncular tract—are highlighted with dashed lines. Approximate borders of the VP, LHb, and VTA are delineated with plain white lines. Coronal sections through two key VP afferents in the d. VTA and e. LHb. IPN interpeduncular nucleus, MHb medial habenula, ac anterior commissure, sm stria medullaris, mfb medial forebrain bundle, fr fasciculus retroflexus. Scale = 200 µm (widefield), and 20 µm (insets). See also Supplementary Figures 2, 3, and 4
Fig. 3
Fig. 3
Stimulation of VP GABA neurons elicits positive reinforcement. a Expression of ChR2:YFP in the VP of VGAT-Cre mouse imaged under epifluorescent (left, scale 200 µm) or apotome (right, scale 20 µm) illumination. Counterstaining with SP (purple) and DAPI (blue), ac anterior commissure, OF optic fiber track. Spread of ChR2:YFP expression in the VP of VGAT-Cre animals (overlapped gray areas for each animal, right panel) and optic fiber tip placements (x marks the spot). b Firing of ChR2:mCh+ VP GABA neurons in response to 40-Hz photostimulation (n = 9 cells); SEM represented in gray. Inset shows representative trace; scale = 20 mV. c In a five-choice nosepoke ICSS task for VP GABA neuron stimulation mice prefer 40-Hz stimulation (n = 7). d When choosing between pulse durations, mice preferred 10 ms pulse width (n = 7). e Over 3 daily 1-h two-nosepoke ICSS sessions, mice made 1141 ± 41 nosepokes for stimulation of VP GABA neurons (n = 6 YFP controls and eight ChR2). f In an RTPP assay, mice preferred the compartment paired with stimulation of VP GABA neurons (n = 9 YFP controls and 10 ChR2). Right panel shows occupation density of an example mouse during the test trial. g Fos+ cells in the VTA increased following ICSS or passive activation of VP GABA neurons (n = 4 VGAT YFP controls, n = 5 VGAT ChR2 passive and ICSS each). The number of VTA cells double positive for the dopamine marker TH and Fos increased following ICSS for VP GABA neuron activation. *p < 0.05, **p < 0.01, ***p < 0.001. See also Supplementary Figures 5 and 6
Fig. 4
Fig. 4
Stimulation of VP glutamate neurons induces place avoidance. a Expression of ChR2:YFP in the VP of VGLUT2-Cre mouse imaged under widefield (left, scale 200 µm) or apotome (right, scale 20 µm) illumination. b Action potential discharge of ChR2:mCherry+ VP glutamate neuron in response to 40-Hz photostimulation (n = 7 cells); SEM represented in gray. Inset shows representative trace; scale = 20 mV. c Over three daily 1-h two-nosepoke ICSS sessions, mice did not demonstrate robust self-stimulation for VP glutamate neurons (n = 5 YFP controls, n = 6 ChR2). d VGLUT2-Cre mice avoided the compartment paired with photostimulation of VP glutamate neurons in the RTPP assay (n = 5 YFP and ChR2 animals). Right panel shows occupation density of an example mouse during a test trial. e Passive activation of VP glutamate neurons failed to increase Fos+ cell counts in the VTA (n = 5). f However, the number of LHb cells positive for Fos increased following passive stimulation of VP glutamate neurons. *p < 0.05, **p < 0.01, ***p < 0.001. See also Supplementary Figure 5
Fig. 5
Fig. 5
Inhibition of VP GABA but not glutamate neurons induce place avoidance. a Expression of Halo:YFP (green) in VP GABA neurons. Counterstaining with SP (purple) and DAPI (blue); OF optic fiber track; ac anterior commissure. b 1-s light pulse inhibits firing of VP GABA neuron; scale = 20 mV, 1 s. Inset shows photocurrent from Halo:YFP-expressing VP GABA neuron in response to 5-ms pulse of green light; scale = 4 pA, 50 ms. c Mice avoid the compartment paired with bilateral inhibition of VP GABA neurons in the RTPP (n = 5 YFP, n = 6 Halo). d Expression of Halo:YFP (green) in VP glutamate neurons. e 1-s light pulse inhibits firing of VP glutamate neuron; scale = 20 mV, 1 s. Inset shows hyperpolarizing photocurrent from Halo:YFP-expressing VP glutamate neuron in response to 5-ms pulse of light; scale = 20 pA, 50 ms. f Bilateral inhibition of VGLUT2+ VP cells did not induce preference or avoidance in the RTPP (n = 5 YFP, n = 8 Halo). Image scale bars = 500 µm (left panels) and 100 µm (right panels); *p < 0.05
Fig. 6
Fig. 6
Activation of VP projections to VTA recapitulates behavioral responses. a Whole-cell recordings in the VTA reveal that single-pulse (5-ms, blue dash) photostimulation of VGAT+ VP terminals triggered PTx-sensitive IPSCs. Pie chart show the fraction of responding neurons, bar graphs show peak IPSC amplitude, insets shows individual cells pre- and post- PTx (n = 7, paired t-test, t(6) = 3.2, p = 0.019); and representative trace; numbers inside bars represent sample size. b Cell-attached recordings in the VTA show that photostimulation of GABA terminals from the VP consistently reduced action potential firing frequency in the VTA (n = 14, Wilcoxon matched-pairs signed-rank test, p = 0.0001). The black scatter plot shows mean change in firing rate 5-s before, during, and after 40-Hz photostimulation, gray axis and plots show individual neuron responses, inset (right) shows a representative trace. c VGAT-Cre mice displayed a preference for the compartment paired with photostimulation of VP terminals in the VTA on the RTPP assay (n = 11) and showed ICSS over three daily sessions (n = 4 YFP, n = 8 ChR2). d Whole-cell recordings, as described in a, show that photostimulation of VGLUT2+ VP terminals in the VTA triggered DNQX-sensitive EPSCs (n = 5, paired t-test, t(4) = 3.75, p = 0.019); e and cell-attached recordings, as described in b, show that train of photostimulation increased action potential firing frequency in the VTA (n = 14, Wilcoxon matched-pairs signed-rank test, p = 0.0001). f VGLUT2-Cre mice showed avoidance for the compartment paired with photostimulation of VP terminals in the VTA on the RTPP assay (n = 6). Example images of ChR2:YFP and optic fiber (OF) tracks in the VTA of c VGAT-Cre or f VGLUT-Cre mice; DAPI (blue), scale = 200 µm. Scales for a and d are 50 pA, 50 ms and 200 pA, 50 ms, respectively; scale for b and e is 1 s; *p < 0.05, **p < 0.01, ***p < 0.001. See also Supplementary Figure 7 and Supplementary Table 3
Fig. 7
Fig. 7
Only activation of VP glutamate but not GABA projections to LHb recapitulates behavioral responses. a Whole-cell recordings in the LHb reveal that single-pulse (5-ms, blue dash) photostimulation of VGAT+ VP terminals triggered PTx-sensitive IPSCs (n = 7, paired t-test, t(6) = 2.19, p = 0.07). Pie chart shows the fraction of responding neurons, bar graphs show peak IPSC amplitude, insets show individual cells pre- and post-PTx and representative trace; numbers inside bars represent sample size. b Cell-attached recordings in the LHb show that photostimulation of GABA terminals from the VP consistently reduced action potential firing frequency in the LHb (n = 12, Wilcoxon matched-pairs signed-rank test, p = 0.0005). The bar graph shows mean change in firing rate 5-s before, during, and after 40-Hz photostimulation, gray axis and plots show individual neuron responses, inset (right) shows a representative trace. c VGAT-Cre mice did not show a preference for the compartment paired with photostimulation of VP terminals in the LHb on the RTPP assay (n = 12) and did not self-stimulate LHb terminals stimulation in the two-nosepoke ICSS task. d Whole-cell recordings, as described in a, show that photostimulation of VGLUT2+ VP terminals in the LHb triggered DNQX-sensitive EPSCs (n = 6, paired t-test, t(5) = 4.73, p = 0.005) as well as PTx-sensitive IPSCs (n = 4, paired t-test, t(3) = 3.77, p = 0.033); e and cell-attached recordings, as described in b, show that train of photostimulation increased (n = 7) or decreased (n = 6) action potential firing frequency in the LHb. f VGLUT2-Cre mice showed avoidance for the compartment paired with photostimulation of VP terminals in the LHb on the RTPP assay (n = 6). Example images of ChR2:YFP and optic fiber (OF) tracks in the LHb of c VGAT-Cre or f VGLUT-Cre mice; DAPI (blue), scale = 200 µm. Scales for a are 250 pA, 50 ms. Scales for d are 200 pA, 50 ms (PTx) and 500 pA, 10 ms (DNQX). Scales for b and e are 1 s; *p < 0.05, **p < 0.01, ***p < 0.001. See also Supplementary Figure 7 and Supplementary Table 3

References

    1. Mogenson GJ, Jones DL, Yim CY. From motivation to action: functional interface between the limbic system and the motor system. Prog. Neurobiol. 1980;14:69–97. doi: 10.1016/0301-0082(80)90018-0. - DOI - PubMed
    1. Root DH, Melendez RI, Zaborszky L, Napier TC. The ventral pallidum: subregion-specific functional anatomy and roles in motivated behaviors. Prog. Neurobiol. 2015;130:29–70. doi: 10.1016/j.pneurobio.2015.03.005. - DOI - PMC - PubMed
    1. Zahm DS, Williams E, Wohltmann C. Ventral striatopallidothalamic projection: IV. Relative involvements of neurochemically distinct subterritories in the ventral pallidum and adjacent parts of the rostroventral forebrain. J. Comp. Neurol. 1996;364:340–362. doi: 10.1002/(SICI)1096-9861(19960108)364:2<340::AID-CNE11>3.0.CO;2-T. - DOI - PubMed
    1. Groenewegen HJ, Berendse HW, Haber SN. Organization of the output of the ventral striatopallidal system in the rat: ventral pallidal efferents. Neuroscience. 1993;57:113–142. doi: 10.1016/0306-4522(93)90115-V. - DOI - PubMed
    1. Calder AJ, et al. Disgust sensitivity predicts the insula and pallidal response to pictures of disgusting foods. Eur. J. Neurosci. 2007;25:3422–3428. doi: 10.1111/j.1460-9568.2007.05604.x. - DOI - PubMed

Publication types

Substances