. 2018 Feb 27;9(1):848.
doi: 10.1038/s41467-018-03308-7.

Multi-indicator sustainability assessment of global food systems

Affiliations

Multi-indicator sustainability assessment of global food systems

Abhishek Chaudhary et al. Nat Commun. .

Abstract

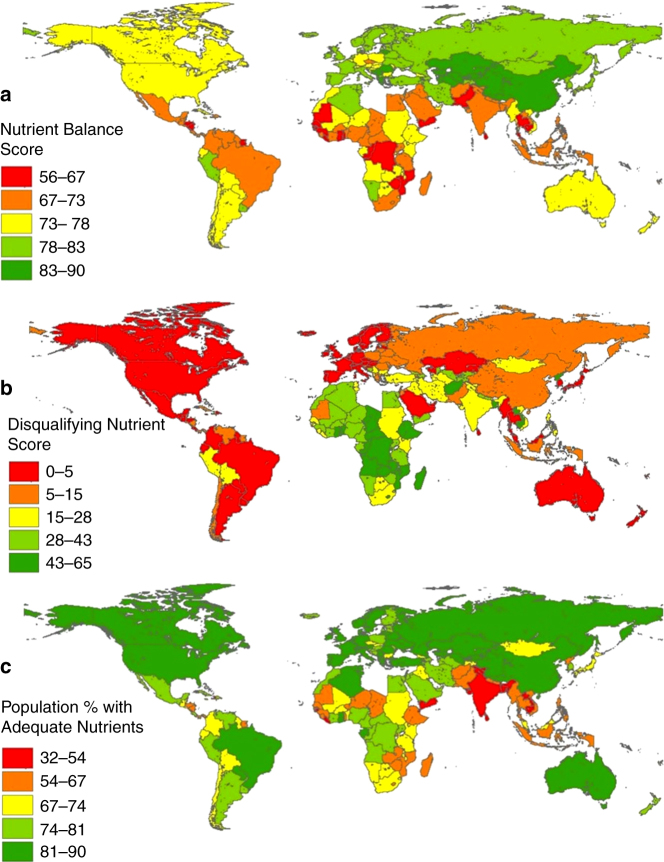
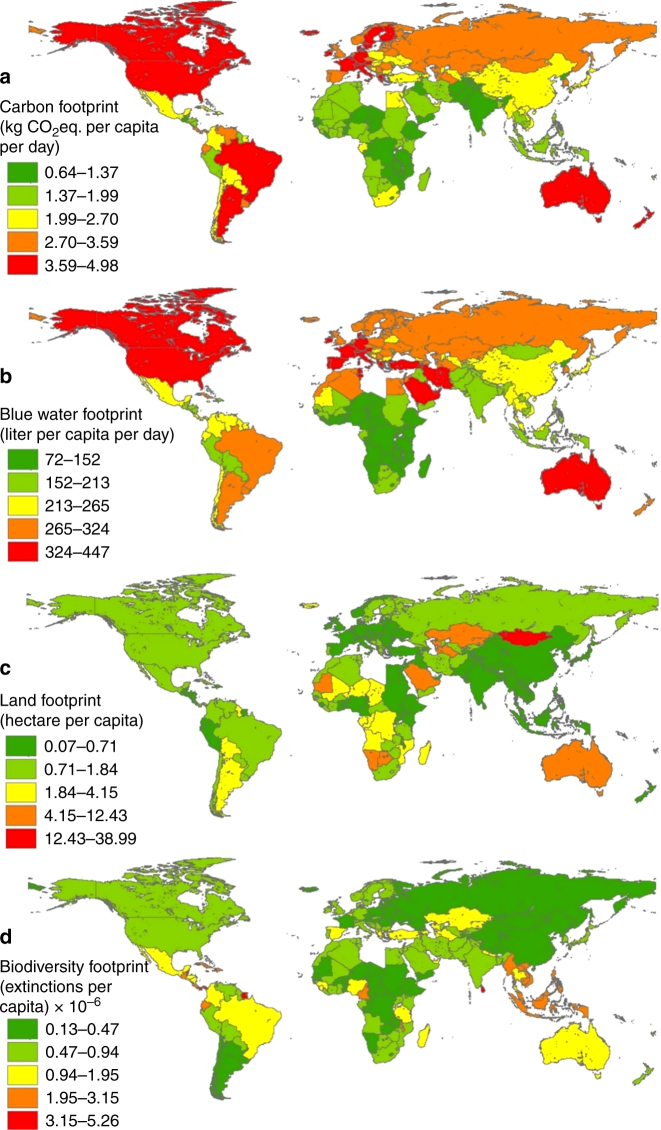
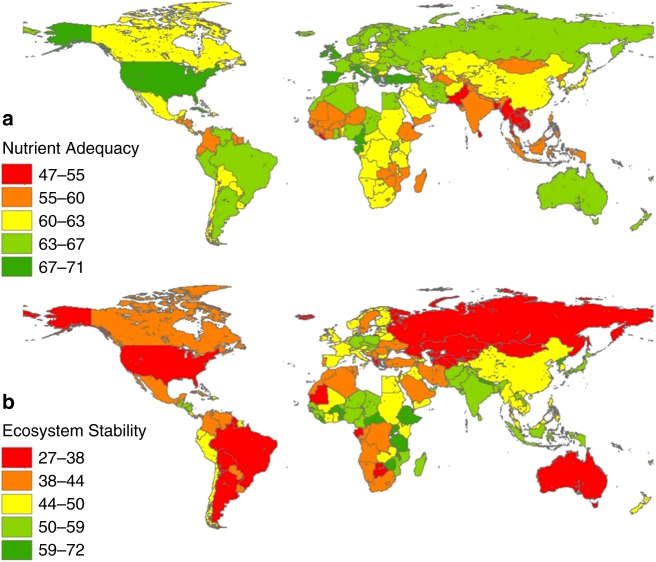
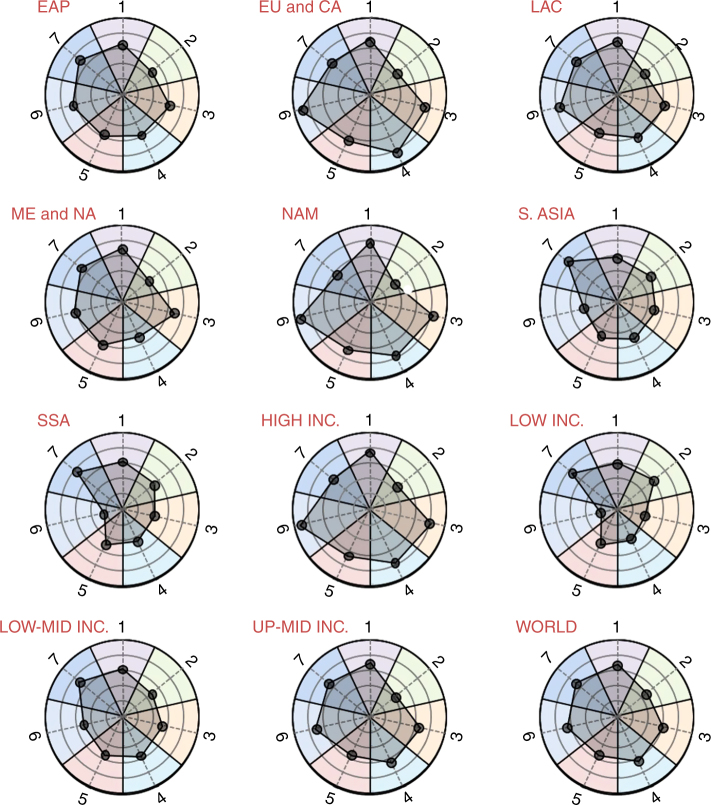
Food systems are at the heart of at least 12 of the 17 Sustainable Development Goals (SDGs). The wide scope of the SDGs call for holistic approaches that integrate previously "siloed" food sustainability assessments. Here we present a first global-scale analysis quantifying the status of national food system performance of 156 countries, employing 25 sustainability indicators across 7 domains as follows: nutrition, environment, food affordability and availability, sociocultural well-being, resilience, food safety, and waste. The results show that different countries have widely varying patterns of performance with unique priorities for improvement. High-income nations score well on most indicators, but poorly on environmental, food waste, and health-sensitive nutrient-intake indicators. Transitioning from animal foods toward plant-based foods would improve indicator scores for most countries. Our nation-specific quantitative results can help policy-makers to set improvement targets on specific areas and adopt new practices, while keeping track of the other aspects of sustainability.


Conflict of interest statement

The authors declare no competing interests.

Figures

Fig. 1
Fig. 1
Food nutrient adequacy indicator scores for 156 countries. a Nutrient Balance Score, b Disqualifying Nutrient Score, and c Population Share with Adequate Nutrients for all countries calculated in this study (year 2011). Countries for which data were not available do not appear on the map (e.g., Somalia). Symbology based on Jenks natural breaks classification method. See Supplementary Data 1 for all values per country
Fig. 2
Fig. 2
Per capita food related environmental footprints of 156 countries. a Carbon, b Blue water, c Land, and d Biodiversity footprint of daily average diets of each country in the year 2011. Symbology based on Jenks natural breaks classification method. See Supplementary Data 1 for normalized (0–100) score of indicators
Fig. 3
Fig. 3
Nutrition and Environmental metrics scores per country. a Food Nutrition Adequacy and b Ecosystem Stability scores for all countries calculated in this study (based on data for the year 2011). Metric score is arithmetic average of its underlying indicator scores (normalized to 0–100). Symbology based on Jenks natural breaks classification method. It can be seen that most countries with high Food Nutrient Adequacy score low on Ecosystem Stability, pointing toward high environmental impacts associated with their diets (see Supplementary Data 1 for all values)
Fig. 4
Fig. 4
Average food system metric scores for different World Bank regions and income levels. The areas of the polygons represent relative national status of food system sustainability (higher the better). The concentric circles are at intervals of 20. 1. Food Nutrient Adequacy; 2. Ecosystem Stability; 3. Food Affordability and Availability; 4. Sociocultural-Wellbeing; 5. Resilience; 6. Food Safety; 7. Waste and Loss Reduction. Regions are as follows: East Asia and Pacific (EAP); Europe and Central Asia (EU&CA); Latin America and Caribbean (LAC); Middle East and North Africa (ME&NA); North America (NAM); South Asia (S. Asia); Sub-Saharan Africa (SSA), and world. Income levels: high, low, lower-middle (LOW-MID INC.), and upper-middle (UP-MID INC)

References

    1. Steffen W, et al. Planetary boundaries: guiding human development on a changing planet. Science. 2015;347:1259855. doi: 10.1126/science.1259855. - DOI - PubMed
    1. United Nations. Transforming our World: The 2030 Agenda for Sustainable Development. Report No. A/RES/70/1 (United Nations, New York, USA, 2015).
    1. Kanter DR, et al. Translating the sustainable development goals into action: a participatory backcasting approach for developing national agricultural transformation pathways. Glob. Food Sec. 2016;10:71–79. doi: 10.1016/j.gfs.2016.08.002. - DOI
    1. Jones AD, et al. A systematic review of the measurement of sustainable diets. Adv. Nutr. 2016;7:641–664. doi: 10.3945/an.115.011015. - DOI - PMC - PubMed
    1. Scarborough P, et al. Dietary greenhouse gas emissions of meat-eaters, fisheaters, vegetarians and vegans in the UK. Clim. Chang. 2014;125:179–192. doi: 10.1007/s10584-014-1169-1. - DOI - PMC - PubMed

Publication types

LinkOut - more resources