. 2018 Feb 27;8(1):3682.
doi: 10.1038/s41598-018-22018-0.

Potential use of superparamagnetic iron oxide nanoparticles for in vitro and in vivo bioimaging of human myoblasts

Affiliations

Potential use of superparamagnetic iron oxide nanoparticles for in vitro and in vivo bioimaging of human myoblasts

Kamil R Wierzbinski et al. Sci Rep. .

Abstract

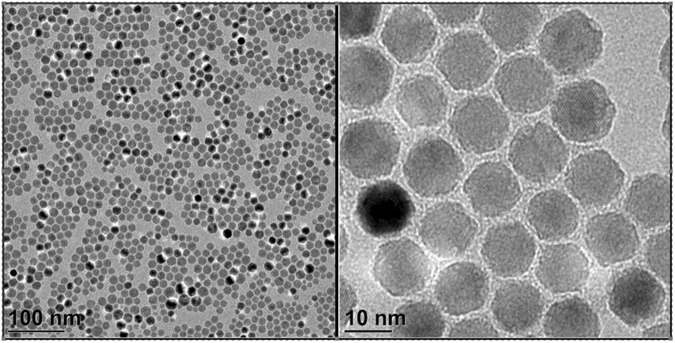
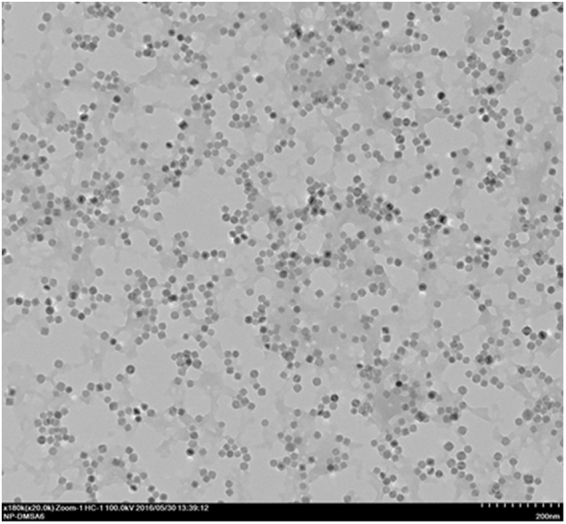
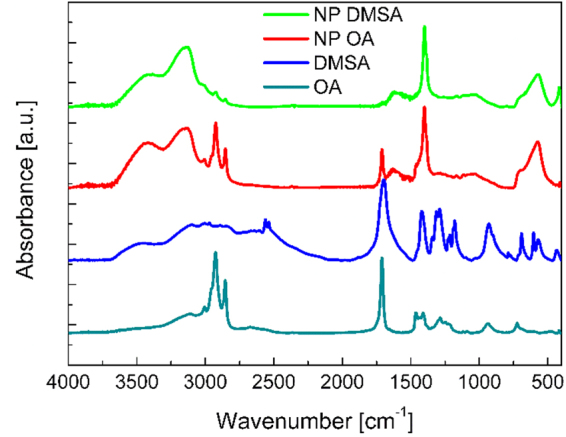
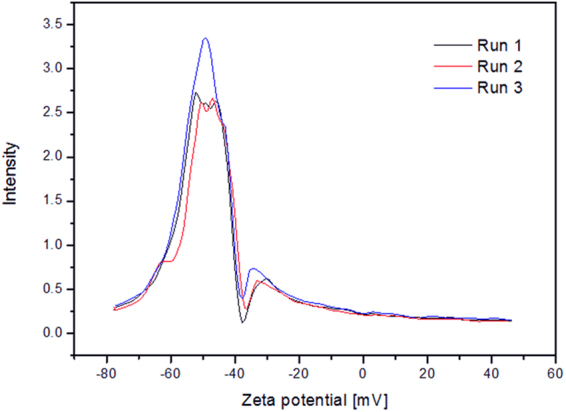
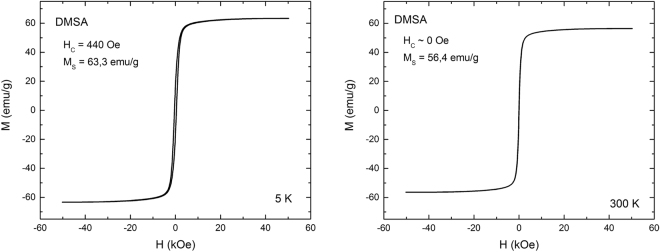
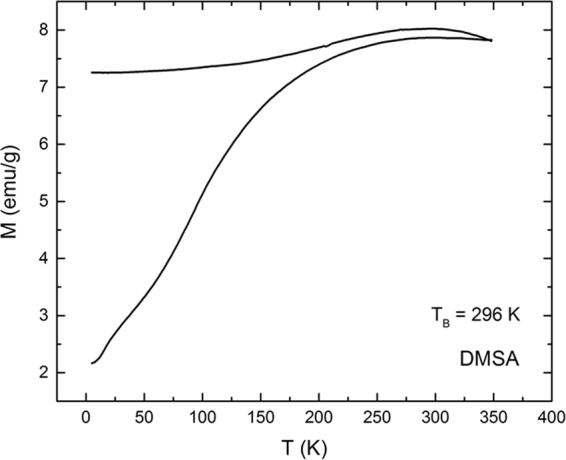
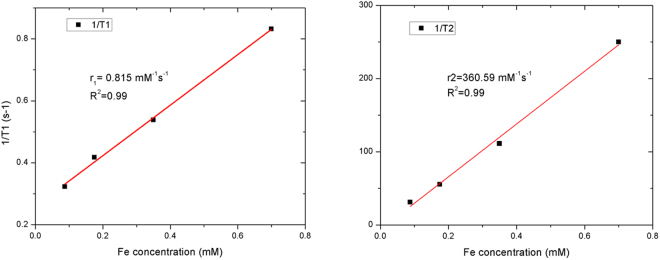
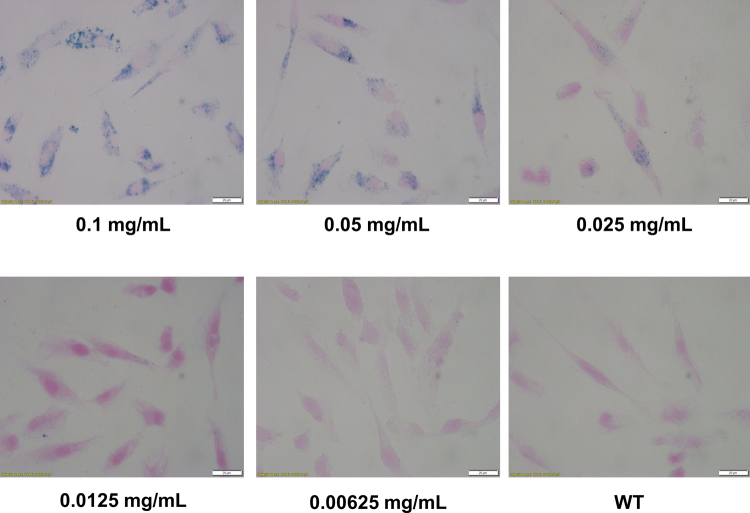
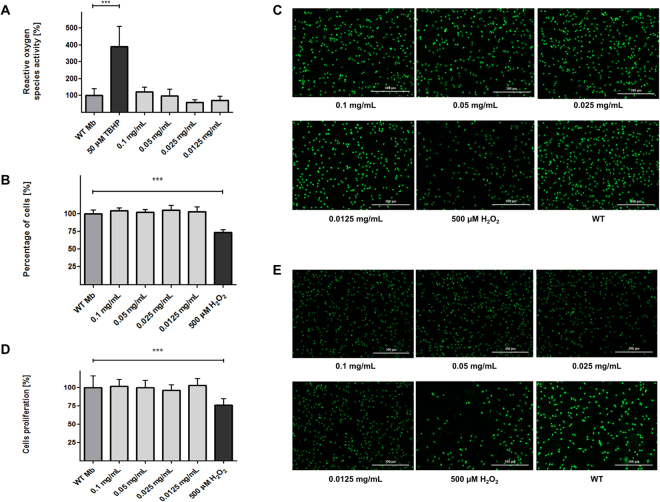
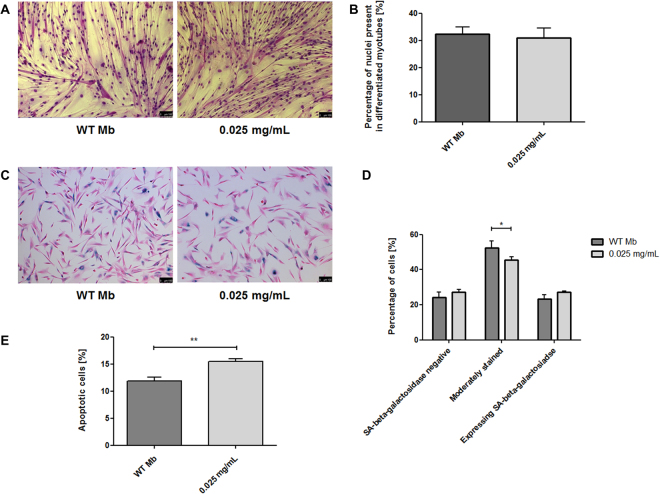
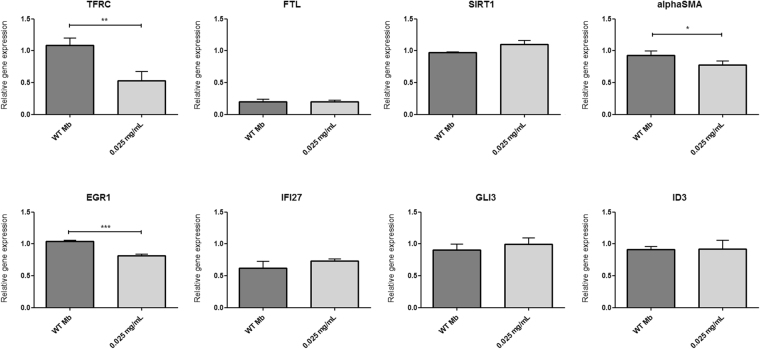
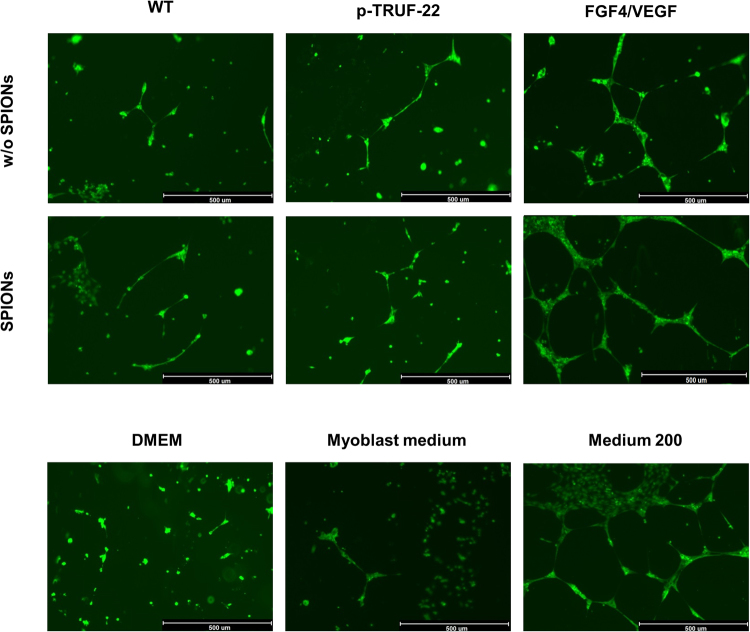
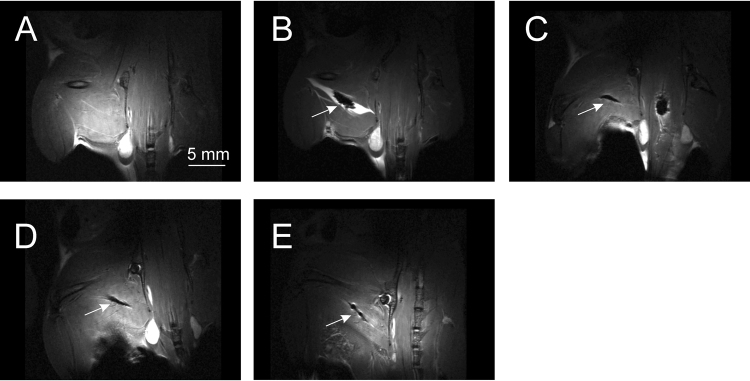
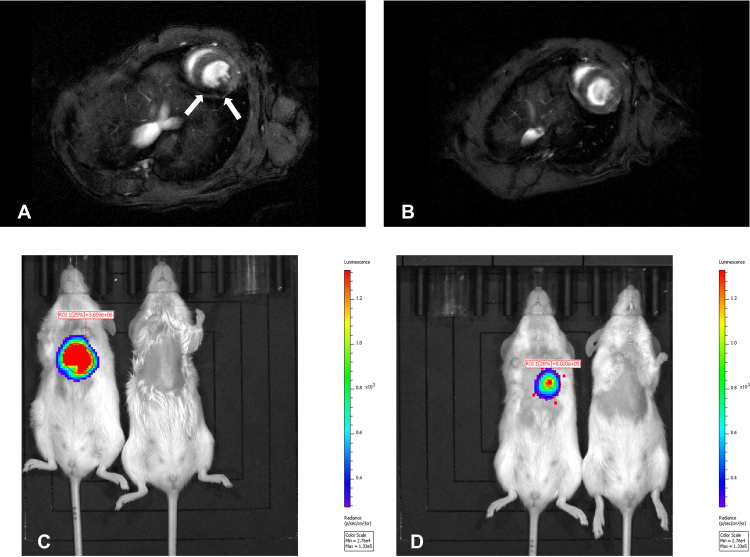
Myocardial infarction (MI) is one of the most frequent causes of death in industrialized countries. Stem cells therapy seems to be very promising for regenerative medicine. Skeletal myoblasts transplantation into postinfarction scar has been shown to be effective in the failing heart but shows limitations such, e.g. cell retention and survival. We synthesized and investigated superparamagnetic iron oxide nanoparticles (SPIONs) as an agent for direct cell labeling, which can be used for stem cells imaging. High quality, monodisperse and biocompatible DMSA-coated SPIONs were obtained with thermal decomposition and subsequent ligand exchange reaction. SPIONs' presence within myoblasts was confirmed by Prussian Blue staining and inductively coupled plasma mass spectrometry (ICP-MS). SPIONs' influence on tested cells was studied by their proliferation, ageing, differentiation potential and ROS production. Cytotoxicity of obtained nanoparticles and myoblast associated apoptosis were also tested, as well as iron-related and coating-related genes expression. We examined SPIONs' impact on overexpression of two pro-angiogenic factors introduced via myoblast electroporation method. Proposed SPION-labeling was sufficient to visualize firefly luciferase-modified and SPION-labeled cells with magnetic resonance imaging (MRI) combined with bioluminescence imaging (BLI) in vivo. The obtained results demonstrated a limited SPIONs' influence on treated skeletal myoblasts, not interfering with basic cell functions.


Conflict of interest statement

The authors declare no competing interests.

Figures

Figure 1
Figure 1
TEM images with nanoparticles synthesized in organic phase. Two different magnifications are presented 105000x and 810000x. Abbreviations: TEM – transmission electron microscope.
Figure 2
Figure 2
Nanoparticle size distribution determined with ImageJ software.
Figure 3
Figure 3
TEM image of DMSA coated nanoparticles. Scale bar indicates 200 nm. Abbreviations: TEM – transmission electron microscope; DMSA – meso-2,3-dimercaptosuccinic acid.
Figure 4
Figure 4
FT-IR plots, representing four spectra: azure – oleic acid, blue – DMSA, red – nanoparticles coated with oleic acid, green – nanoparticles coated with DMSA. Abbreviations: FT-IR – Fourier Transformed Infrared Spectroscopy; DMSA - meso-2,3-dimercaptosuccinic acid.
Figure 5
Figure 5
Zeta potential plot, 3 measurements are presented.
Figure 6
Figure 6
Hysteresis loops for 5 K and 300 K obtained by SQUID magnetometer.
Figure 7
Figure 7
ZFC-FC plot, presenting blocking temperature of DMSA-coated nanoparticles.
Figure 8
Figure 8
T1 and T2 relaxation time plots as a function of iron atoms concentration.
Figure 9
Figure 9
Prussian Blue staining of human myoblasts cultured in different concentrations of superparamagnetic iron oxide nanoparticles (SPIONs). Abbreviations: WT - myoblasts cultured in medium without Fe3O4-NPs. All images were taken in bright field setting with magnification 100x. Scale bars indicate 100 μm.
Figure 10
Figure 10
(A) Analysis of the reactive oxygen species activity in the studied populations of human myoblasts. The graph illustrates the relative fluorescence in tested cell populations comparing to the fluorescence of WT Mb. All cells were treated with 2′,7′-dichlorofluorescin diacetate. Positive control: 50 µM TBHP - myoblasts non-labeled with SPIONs, treated with 2′,7′-dichlorofluorescin diacetate and 50 µM tert-butyl Hydrogen Peroxide (TBHP). No significant differences between the populations under study were observed. (B,C) Evaluation of potential cytotoxicity of obtained SPIONs. The graph illustrates the relative fluorescence in tested cell populations comparing to the fluorescence of WT Mb (B). No significant differences between the populations under study were observed. The images show fluorescent stained nuclei of only vivid cells in investigated groups (C). (D,E) Examination of impact of obtained nanoparticles on investigated cells proliferation ability. The graph illustrates the relative fluorescence in tested cell populations comparing to the fluorescence WT Mb (D). No significant differences between the populations under study were observed. The images illustrate fluorescent stained nuclei of only vivid cells in investigated samples 72 h after exposure of cells to nanoparticles (E). Abbreviations: WT Mb – myoblasts non-labeled with SPIONs. Asterisks indicate statistical significance (***p < 0.001). Scale bars indicate 300 µm.
Figure 11
Figure 11
(A,B) Analysis of the differentiation potentials of human myoblasts. The images illustrate the potential of the Mb WT and labeled cell populations for differentiation into multinucleated myotubes (A). No significant differences between the populations under study were observed (B). (C,D) β-galactosidase staining assay. The images show Mb WT and labeled cells stained with SA-beta-galactosidase (C), Cell aging evaluation in myoblast populations under study (D). (E) Analysis of apoptosis in the studied populations of human myoblasts. Slightly increased cell apoptosis under normal in vitro cell culture conditions was observed in labeled cell population. Abbreviations: Mb WT – non-labeled myoblasts. Asterisks indicate statistical significance (*p < 0.05; **p < 0.01). Scale bars indicate 100 µm.
Figure 12
Figure 12
Expression of selected genes in the studied populations of human myoblasts evaluated by real-time qPCR. The relative expression of genes was normalized according to the expression of a housekeeping genes: β-actin, HPRT1 and GAPDH. The data are presented as a relative mRNA fold. Asterisks indicate statistical significance (*p < 0.05; **p < 0.01; ***p < 0.001). Abbreviations: Mb WT – non-labeled myoblasts; HPRT1 – hypoxanthine phosphoribosyltransferase 1; GAPDH – glyceraldehyde-3-phosphate dehydrogenase; TFRC – transferrin receptor 1; FTL – ferritin light chain; SIRT1 – sirtuin 1; alphaSMA – alpha smooth muscle actin; EGR1 – early growth response 1; IFI27 – interferon alpha inducible protein 27; GLI3 – GLI family zinc finger 3; ID3 – inhibitor of DNA binding 3
Figure 13
Figure 13
HUVEC angiogenesis test. To evaluate the pro-angiogenic properties of secreted proteins in the supernatants collected from myoblasts under study, the tested samples were transferred onto prepared HUVEC cells. Supernatants were collected from: WT – non transfected myoblasts; p-TRUF-22 – mock transfected myoblasts; FGF-4/VEGF – myoblasts transfected with complete bicistronic plasmid; w/o SPIONs – myoblasts non-labeled with obtained SPIONs; SPIONs – myoblast labeled with obtained SPIONs (0.025 mg/µL medium). Negative controls: DMEM and fresh myoblast medium. Positive control: medium 200 (with Large Vessel Endothelial Supplement). Capillaries were stained with calcein. Scale bars indicate 500 µm.
Figure 14
Figure 14
T2-weighted MR images of a mouse intramuscularly injected with SPION-labeled cells. Images were obtained before (A), immediately after the injection (B), one (C), two (D) and seven days (E) after the cell administration. Arrows point the hypointensive area at the site of injection. Bar represents 5 mm.
Figure 15
Figure 15
In vivo visualization of firefly luciferase-transduced myoblasts labeled with SPIONs. T2-weighted MR images were produced in mouse intracardially injected with SPION-labeled cells (A) versus control mouse (B). Arrows point out the hypointensive area at the site of injection. Bioluminescent imaging was acquired at 5 (C) and 12 (D) days after administration of cells and showed their distinct bioluminescent activity (left) as comparing to control mouse (right).

References

    1. Zhang, L., Wang, X., Zou, J., Liu, Y. & Wang, J. DMSA-Coated Iron Oxide Nanoparticles Greatly Affect the Expression of Genes Coding Cysteine-Rich Proteins by Their DMSA Coating. Chem. Res. Toxicol.28, 1961–1974 (2015). - PubMed
    1. Jarockyte, G. et al. Accumulation and toxicity of superparamagnetic iron oxide nanoparticles in cells and experimental animals. Int. J. Mol. Sci.17, 1193 (2016). - PMC - PubMed
    1. Zou J, Wang X, Zhang L, Wang J. Iron Nanoparticles Significantly Affect the In Vitro and In Vivo Expression of Id Genes. Chem. Res. Toxicol. 2015;28:373–383. doi: 10.1021/tx500333q. - DOI - PubMed
    1. Ali A, et al. Synthesis, characterization, applications, and challenges of iron oxide nanoparticles. Nanotechnology, Science and Applications. 2016;9:49–67. doi: 10.2147/NSA.S99986. - DOI - PMC - PubMed
    1. Jeon, S., Hurley, K. R., Bischof, J. C., Haynes, C. L. & Hogan, C. J. Quantifying intra- and extracellular aggregation of iron oxide nanoparticles and its influence on specific absorption rate. Nanoscale8, 16053–16064 (2016). - PubMed

Publication types

MeSH terms