. 2018 Feb 27;8(1):3725.
doi: 10.1038/s41598-018-21751-w.

Pancreatic alpha cells in diabetic rats express active GLP-1 receptor: Endosomal co-localization of GLP-1/GLP-1R complex functioning through intra-islet paracrine mechanism

Affiliations

Pancreatic alpha cells in diabetic rats express active GLP-1 receptor: Endosomal co-localization of GLP-1/GLP-1R complex functioning through intra-islet paracrine mechanism

Koji Nakashima et al. Sci Rep. .

Abstract

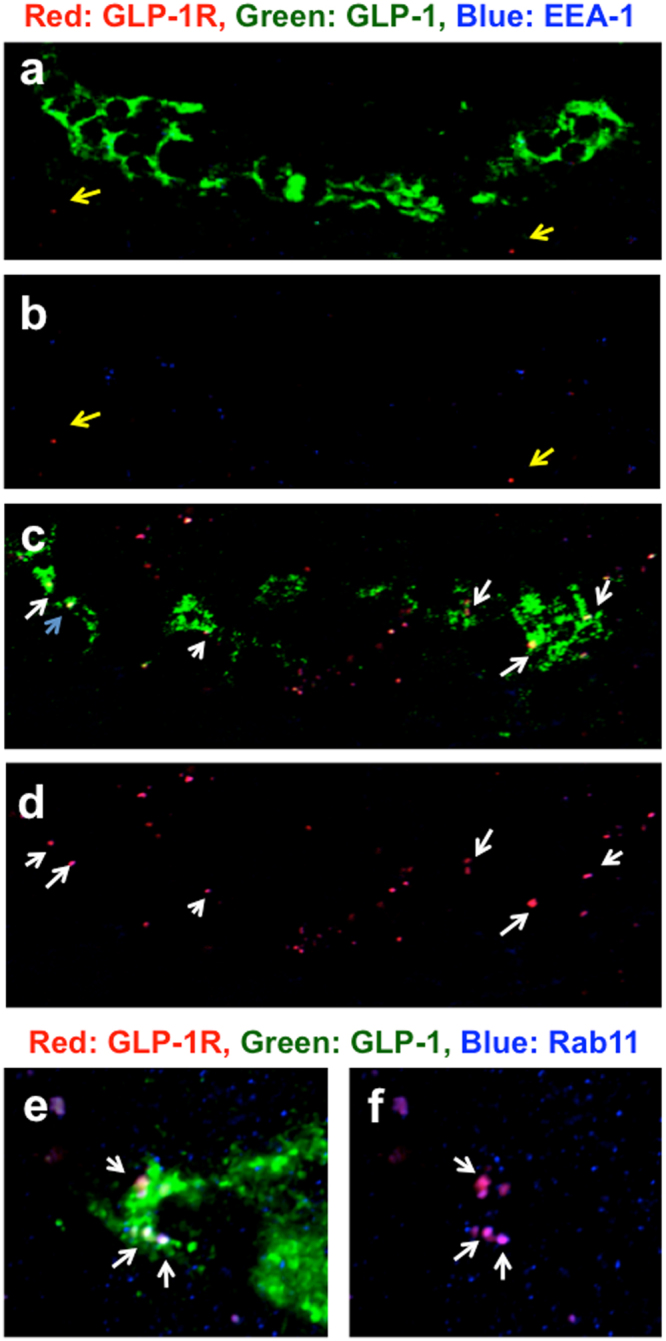
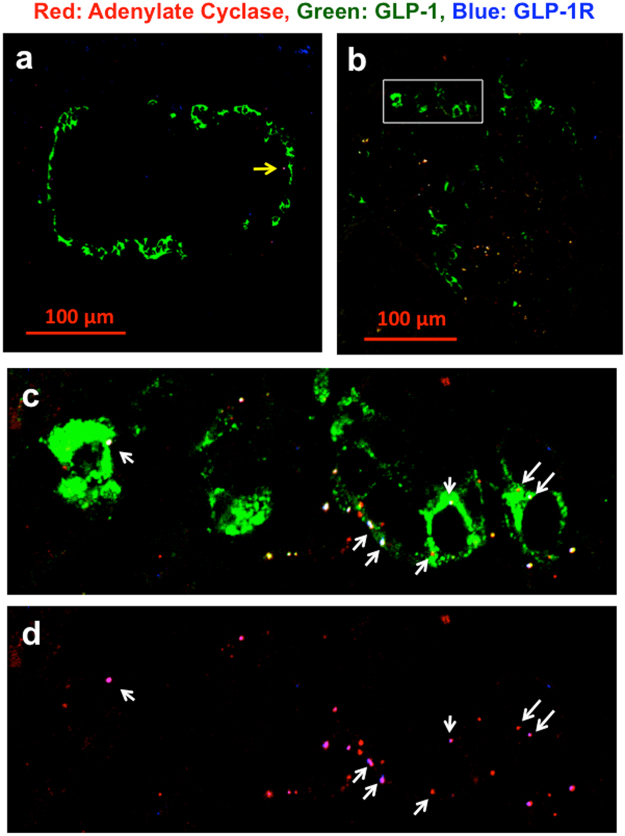
Glucagon-like peptide-1 (GLP-1) stimulates insulin secretion from pancreatic beta cells and suppresses glucagon secretion from alpha cells. It remains controversial, however, whether GLP-1 receptor (GLP-1R) is expressed in mature alpha cells. In this study, unlike previous studies using non-diabetic animals, we demonstrated using diabetic model rats and confocal laser scanning microscopy that the GLP-1/GLP-1R complex was located in the endosome of diabetic islets. In addition, we showed that GLP-1 and GLP-1R co-localized with various endosomal markers and adenylate cyclase in the alpha cells of diabetic rats. Diabetic rats had endosomal signaling pathway but normal rats had classical signaling pathway for activated GLP-1R. Furthermore, we performed pancreatic perfusion to assess the functional activity of GLP-1R when stimulated by exendin-4 (EX4). In a pancreas perfusion study, EX4 significantly stimulated glucagon secretion in diabetic rats but not normal rats. However, such glucagon secretion was immediately suppressed, probably due to concomitantly secreted insulin. The GLP-1/GLP-1R complex appears to function through an intra-islet paracrine mechanism in diabetic conditions which could explain, at least in part, the mechanism of paradoxical hyperglucagonaemia in type 2 diabetes.


Conflict of interest statement

The authors declare no competing interests.

Figures

Figure 1
Figure 1
Co-localization of red GLP-1R, green GLP-1 and blue EEA-1 in islets of non-diabetic and diabetic rats. Confocal laser microscopy (CLM) images in a (a) 25- week-old non-diabetic Wistar rat (BW 489 g, FBS 119 mg/dl) and (b) 25-week-old diabetic GK rat (BW 370 g, FBS 210 mg/dl) were taken at 20× magnification. The white rectangular area containing large endosomes in Fig. 1b was taken at 64× magnification and was split into red GLP-1R (c), green GLP-1 (d) and blue EEA-1 (e). Figure 1f is a merged image of Fig. 1c–e. The yellow and red arrows indicate small and large endosomes, respectively. The red rectangular areas in Fig. 1a and b are shown again in Fig. 4a–d. Since we used no detergent or antigen retrieval reagent in this endosomal co-localization study to avoid destroying the structure of endosomes, in this system, it is very difficult to detect the expression of GLP-1R, which should be present in beta cell membrane. The epitope of GLP-1R in endosomes is preserved and recognized even without any detergent or antigen retrieval reagent. Therefore, the method in this study specifically detects GLP-1R in endosomes.
Figure 2
Figure 2
Co-localization of red GLP-1R, green GLP-1 and blue Rab11 in islets of non-diabetic and diabetic rats. CLM images of a (a) 25-week-old non-diabetic Wistar rat (BW 489 g, FBS 119 mg/dl) and (b) 25-week-old diabetic GK rat (BW 419 g, FBS 230 mg/dl) taken at 20× magnification. The yellow arrow in Fig. 2a indicates a small red dot in non-alpha cells. The red rectangular area in Fig. 2b is split and shown again in Supple. Figure 4. The yellow rectangular area in Fig. 2b is shown again in Fig. 4e and f.
Figure 3
Figure 3
Co-localization of red GLP-1R, green GLP-1 and blue Rab7 in islets of non-diabetic and diabetic rats. CLM images in a (a) 25-week-old non-diabetic Wistar rat (BW 489 g, FBS 119 mg/dl) and (b) 25-week-old diabetic GK rat (BW 450 g, FBS 249 mg/dl) were taken at 20× magnification. The yellow arrow in Fig. 2a indicates a small red dot in non-alpha cells. The CLM image in the white rectangular area in Fig. 3b was taken at 63× magnification and split into red GLP-1R (c), green GLP-1 (d) and blue Rab7 (e). Figure 3f is a merged image of Fig. 3c–e. Figure 3g is a differential interference contrast (DIC) microscopy image that was taken simultaneously. Figure 3h is a merged image of Fig. 3f and g. The yellow and orange arrows in Fig. 3c–h indicate large and small endosomes, respectively. The green arrows in Fig. 3c–h indicate one of the small endosomes. The white arrows in Fig. 3d indicate cytoplasmic GLP-1-positive alpha cells.
Figure 4
Figure 4
Endosomal co-localization of the GLP-1/GLP-1R complex in alpha cells in non-diabetic and diabetic rats. Figure 4a was taken from the red rectangular area in Figs 1a and 4b is a merged image of the red GLP-1R and blue EEA-1. Figure 4c was taken from the red rectangular area in Figs 1b and 4d is a merged image of the red GLP-1R and blue EEA-1. Figure 4e was taken from the yellow rectangular area in Fig. 2b with red GLP-1R, green GLP-1 and blue Rab11, and Fig. 4f is a merged image of the red GLP-1R and blue Rab11 in Fig. 4e. The yellow arrows indicate red GLP-1 R, which is not located in alpha cells. The white arrows in Fig. 4c and e indicate the co-localization of GLP-1R and endosome markers EEA-1 and Rab11, respectively, in alpha cells.
Figure 5
Figure 5
Co-localization of red adenylate cyclase (AC), green GLP-1 and blue GLP-1R. CLM images in a (a) 25-week-old non-diabetic Wistar rat (BW 487 g, FBS 119 mg/dl) and (b) 25-week-old GK rat (BW 370, FBS 125 mg/dl). The yellow arrows in Fig. 5a indicate a red dot in the non-alpha cell area. The white rectangular area in Fig. 5b was taken at 63× magnification and shown as Fig. 5c. Figure 5d is a merged image of AC and GLP-1R. The white arrows indicate the merging of AC and GLP-1R in alpha cells.
Figure 6
Figure 6
CML image of red AC, green GLP-1 and blue Rab5 in a (a) 10- week-old non-diabetic Wistar rat (BW 318 g, FBS 108 mg/dl) and (b) 10-week-old diabetic Wistar rat treated with STZ (BW 334, FBS 318 mg/dl). Figure 6c is a magnified image taken from the white rectangular area in Fig. 6b. Figure 6d is a merged image of the red AC and blue Rab5 in Fig. 6c. The yellow arrows indicate red AC, which is not located in alpha cells. The white arrows indicate the merging of AC and Rab7 in alpha cells.
Figure 7
Figure 7
Isolated pancreatic perfusion profile of diabetic rats stimulated by EX4 and IBMX. (a) 11-week-old F344/Jcl rat (BW 276 g, FBS 110 mg/dl). 1–20 min, 5.5 mM glucose; 21–60 min, 5,5 mM glucose and 10 nM Exendin-4. (b) 12-week-old F344/Jcl rat treated with STZ (BW 194 g, FBS 291 mg/dl). 1–20 min, 5.5 mM glucose; 21–41 min, 5,5 mM glucose and 10 nM Exendin-4; 41–60 min, 5,5 mM glucose and 2.0 mM IBMX. (c) 10-week-old Wistar rat treated with STZ (BW 302 g, BS 472 mg/dl). 1–20 min, 5.5 mM glucose; 21–60 min, 5.5 mM glucose and 10 nM EX4; 61–80 min, 5.5 mM glucose and 2 mM IBMX. (d) 25-week-old GK rat (BW 370 g, BS 220 mg/dl). 1–20 min, 5.5 mM glucose; 21–60 min, 5.5 mM glucose and 10 nM EX4; 61–80 min, 5.5 mM glucose and 2 mM IBMX.
Figure 8
Figure 8
Isolated pancreatic perfusion profile of diabetic rats stimulated high glucose and EX4. 8-week-old GK rat (BW 272 g, BS 368 mg/dl). 1–20 min, 5.5 mM glucose; 21–60 min, 15 mM glucose; 61–80 min, 15 mM glucose and 10 nM EX4. Red arrows indicate elevation of GLP-1, insulin or glucagon secretion. Blue arrows indicate suppression of glucagon secretion.

Similar articles

Cited by

References

    1. Prasad-Reddy L, Isaacs D. A clinical review of GLP-1 receptor agonists: efficacy and safety in diabetes and beyond. Drugs Context. 2015;4:212283. doi: 10.7573/dic.212283. - DOI - PMC - PubMed
    1. Deacon CF. Dipeptidyl peptidase-4 inhibitors in the treatment of type 2 diabetes: a comparative review. Diabetes Obes Metab. 2011;13:7–18. doi: 10.1111/j.1463-1326.2010.01306.x. - DOI - PubMed
    1. Heller RS, Aponte GW. Intra-islet regulation of hormone secretion by glucagon-like peptide-1-(7–36) amide. Am J Physiol. 1995;269:G852–860. - PubMed
    1. Masur K, Tibaduiza EC, Chen C, Ligon B, Beinborn M. Basal receptor activation by locally produced glucagon-like peptide-1 contributes to maintaining beta-cell function. Mol Endocrinol. 2005;19:1373–1382. doi: 10.1210/me.2004-0350. - DOI - PubMed
    1. Fava GE, Dong EW, Wu H. Intra-islet glucagon-like peptide 1. J Diabetes Complications. 2016;30:1651–1658. doi: 10.1016/j.jdiacomp.2016.05.016. - DOI - PMC - PubMed

Publication types