. 2018 Feb 27;8(1):3674.
doi: 10.1038/s41598-018-21861-5.

FoxP3 isoforms and PD-1 expression by T regulatory cells in multiple sclerosis

Affiliations

FoxP3 isoforms and PD-1 expression by T regulatory cells in multiple sclerosis

Manolo Sambucci et al. Sci Rep. .

Abstract

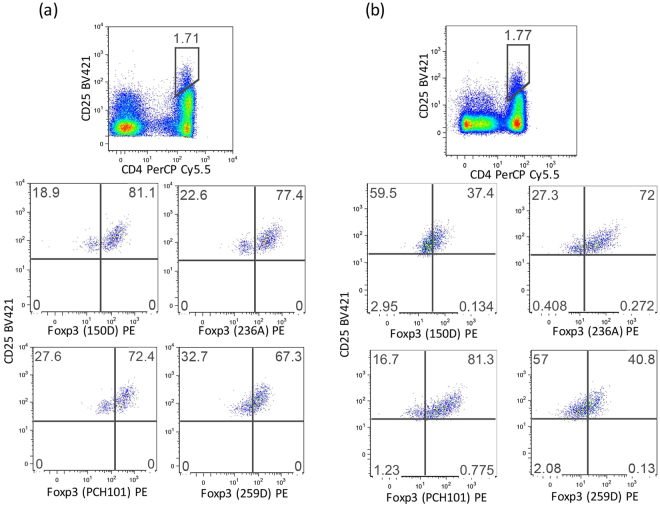
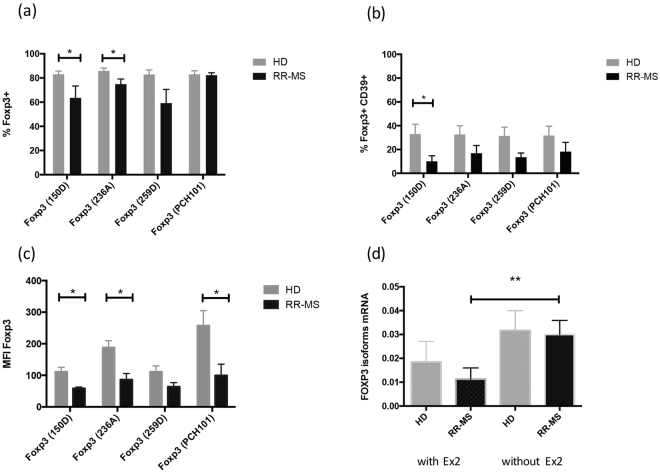
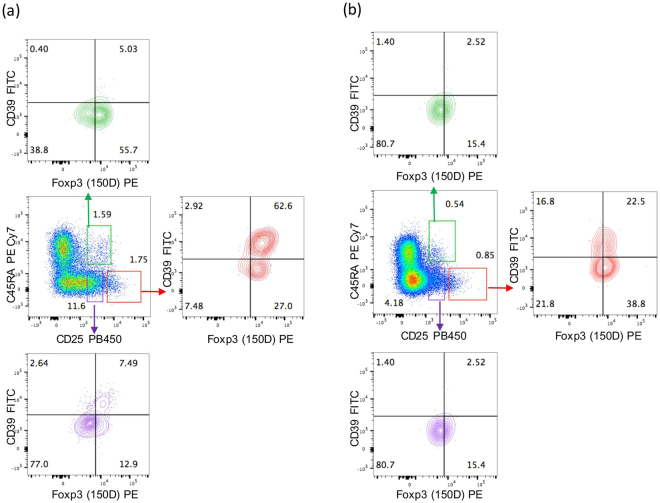
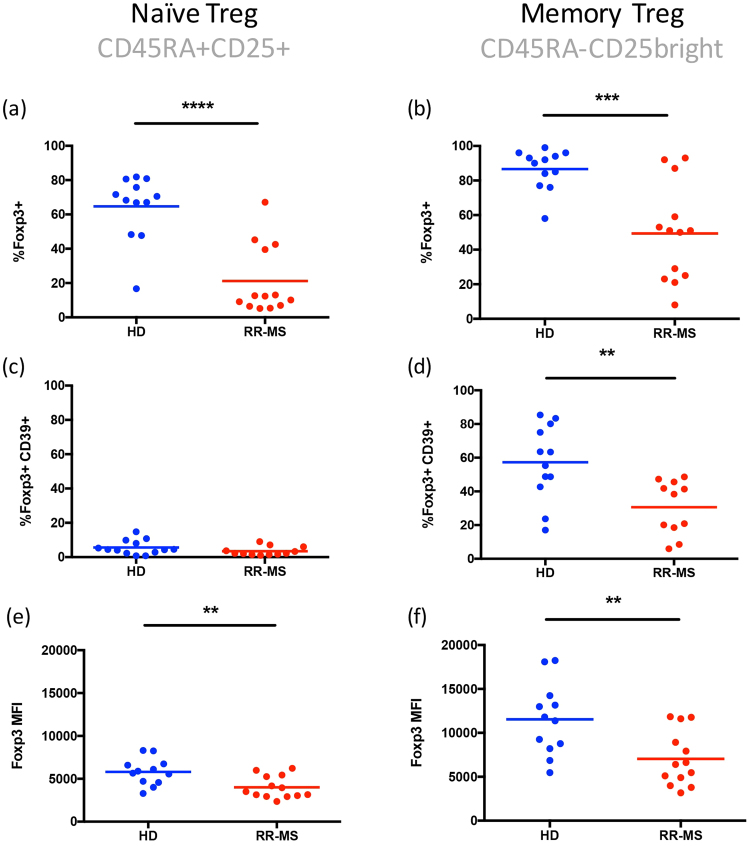
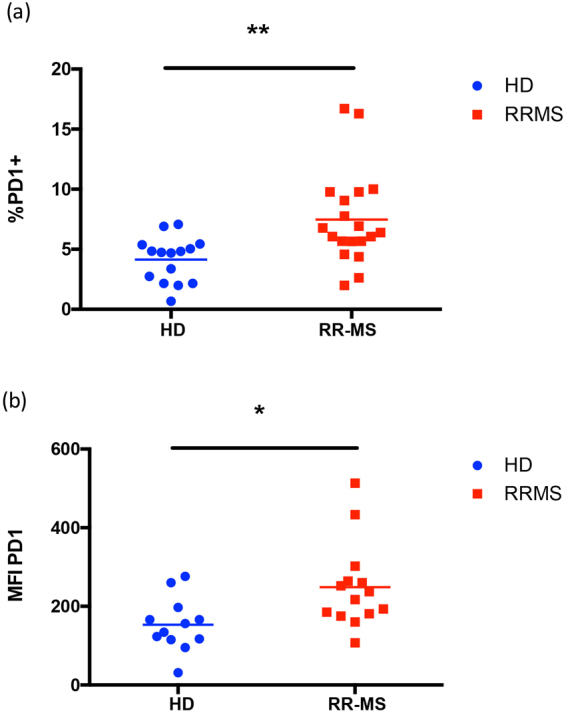
Forkhead box P3 (FoxP3)+ regulatory T cells (Treg) are powerful mediators of immune regulation and immune homeostasis. In humans, Tregs are a heterogeneous population expressing surface markers which define phenotypically and functionally distinct subsets. Moreover, it is now clear that intracellular staining for FoxP3 does not unequivocally identify "true" suppressor cells, since several FoxP3 isoforms exist, and different reagents for FoxP3 detection are available. Here, we propose a strategy to identify potentially functional and suppressive Treg cells in an autoimmune disease like multiple sclerosis, and we suggest that in patients affected by this disease these cells are both reduced in number and functionally exhausted.


Conflict of interest statement

The authors declare no competing interests.

Figures

Figure 1
Figure 1
Representative plots showing the frequencies for Treg cells in PBMCs from a healthy donor (a) and an MS patient (b). PBMCs from the same sample were stained in 4 replicates with the different anti- FoxP3 clones (150D, 236A, 259D, PCH101). Numbers indicate percent of cells in each quadrant.
Figure 2
Figure 2
Frequencies and Median Fluorescence Intensity (MFI) of FoxP3+ cells within CD4+CD25bright cells (a,c) or CD4+CD25brightCD39+ cells (b) from the PBMCs of HD (grey bar, n = 6) or MS individuals (black bar, n = 6). (d) rtPCR quantification of FOXP3 transcripts expressing exon 2 (with Ex2), without exon 2 (without Ex2) on CD4+CD25high sorted cells obtained from RRMS patients (n = 4) or healthy donors (n = 4). Significant values: *p < 0.05; **p < 0.001. Statistical comparisons were performed by Student’s paired T test.
Figure 3
Figure 3
Definition of subpopulations of Treg cells by detection of cell surface molecules in one representative healthy donor (a) and one representative MS patient (b). PBMCs were stained for CD4, CD25, CD39, CD45RA, and FoxP3-exon2 (anti-FoxP3 clone 150D). Numbers indicate percent of cells in each quadrant. Three main subsets of CD4+ cells containing different levels of FoxP3 were defined by the expression of CD45RA and CD25: naïve Treg cells (CD45RA+ CD25+), memory Treg (CD45RA CD25+), activated Treg (CD45RA CD25++). In each subset the combination with CD39 and FoxP3-exon2 identifies true Treg cells.
Figure 4
Figure 4
Percentage of FoxP3+ (a,b) and of FoxP3+CD39+ cells (c,d) within naïve and memory Treg cells. MFI of FoxP3 in naïve (e) and memory (f) Treg cells. Blue dots: healthy donors (n = 12); red dots: MS patients (n = 13). Statistical comparisons were performed by Student’s unpaired T test. Significant values: **p < 0.005, ***p < 0.001, ****p < 0.0001.
Figure 5
Figure 5
PD-1 expression measured as percent of positive cells (a) or MFI (b). PD-1 expression was measured on cells gated on blue dots: healthy donors (n = 12); red dots: MS patients (n = 13). Statistical comparisons were performed by Student’s unpaired T test. Cells were gated on CD4+CD25brightFoxP3-exon2+ *p < 0.05, **p < 0.005.

References

    1. Sakaguchi S, Miyara M, Costantino CM, Hafler DA. FOXP3+ regulatory T cells in the human immune system. Nat Rev Immunol. 2010;10:490–500. doi: 10.1038/nri2785. - DOI - PubMed
    1. Hsieh CS, Lee HM, Lio CW. Selection of regulatory T cells in the thymus. Nat Rev Immunol. 2012;12:157–167. doi: 10.1038/nri3155. - DOI - PubMed
    1. Ohkura N, Sakaguchi S. Regulatory T cells: roles of T cell receptor for their development and function. Semin Immunopathol. 2010;32:95–106. doi: 10.1007/s00281-010-0200-5. - DOI - PubMed
    1. Brunkow ME, et al. Disruption of a new forkhead/winged-helix protein, scurfin, results in the fatal lymphoproliferative disorder of the scurfy mouse. Nat Genet. 2001;27:68–73. doi: 10.1038/83784. - DOI - PubMed
    1. Wildin RS, et al. X-linked neonatal diabetes mellitus, enteropathy and endocrinopathy syndrome is the human equivalent of mouse scurfy. Nat Genet. 2001;27:18–20. doi: 10.1038/83707. - DOI - PubMed

Publication types