. 2018 Feb 27;8(1):3737.
doi: 10.1038/s41598-018-22126-x.

A validation and extended description of the Lund taxonomy for urothelial carcinoma using the TCGA cohort

Affiliations

A validation and extended description of the Lund taxonomy for urothelial carcinoma using the TCGA cohort

Nour-Al-Dain Marzouka et al. Sci Rep. .

Abstract

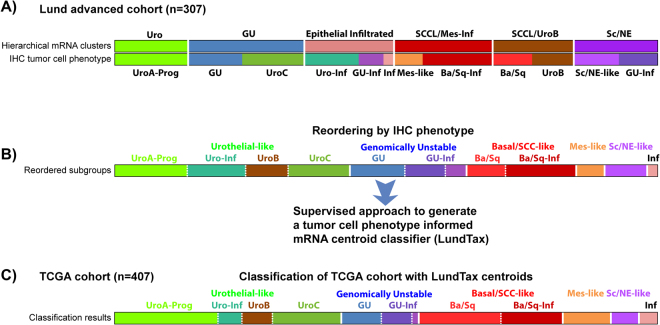
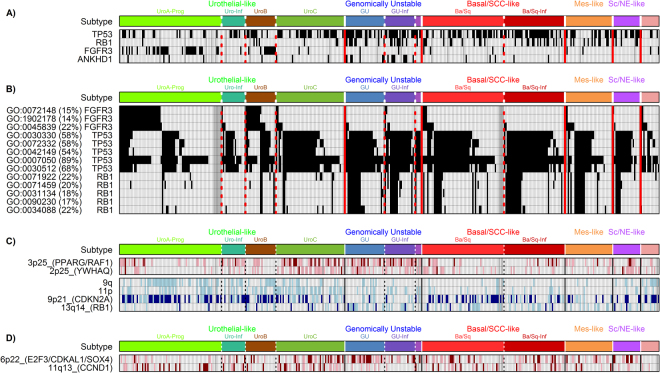
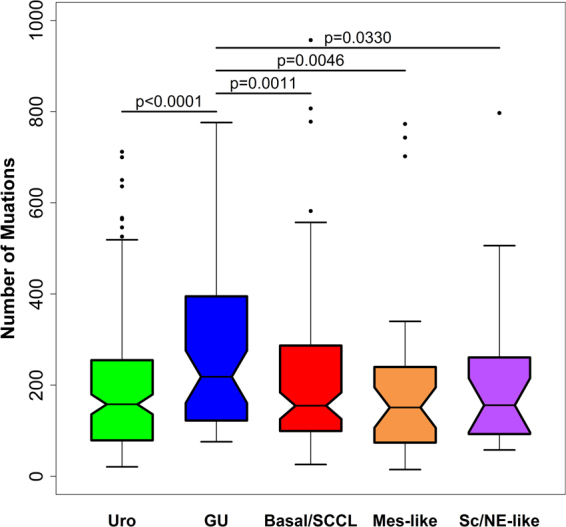
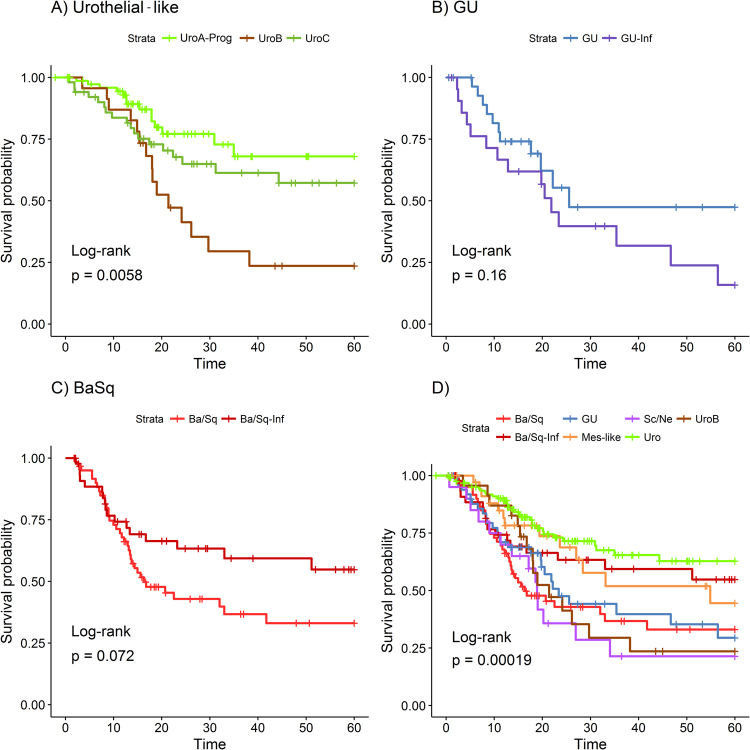
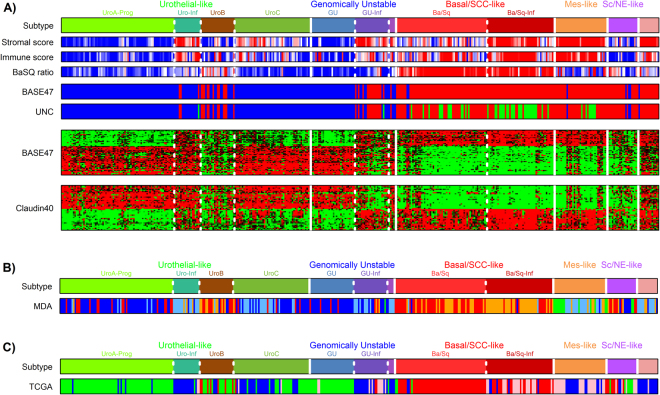
Global gene expression analysis has been a major tool for urothelial carcinoma subtype discovery. This approach has revealed extensive complexity both in intrinsic features of the tumor cells and in the microenvironment. However, global gene expression cannot distinguish between gene expression signals originating from the tumor cells proper and from normal cells in the biopsy. Here, we use a large cohort of advanced urothelial carcinomas for which both gene expression data and extensive immunohistochemistry are available to create a supervised mRNA expression centroid classifier. This classifier identifies the major Lund taxonomy tumor cell phenotypes as defined by IHC. We apply this classifier to the independent TCGA dataset and show excellent associations between identified subtypes and genomic features. We validate a progressed version of Urothelial-like A (UroA-Prog) that shows FGFR3 mutations and CDKN2A deletions, and we show that the variant Urothelial-like C is almost devoid of FGFR3 mutations. We show that Genomically Unstable tumors are very distinct from Urothelial-like tumors at the genomic level, and that tumors classified as Basal/SCC-like all complied with the established definition for Basal/SCC-like tumors. We identify the Mesenchymal-like and Small-cell/Neuroendocrine-like subtypes, and demonstrate that patients with UroB and Sc/NE-like tumors show the worst overall survival.


Conflict of interest statement

The authors declare no competing interests.

Figures

Figure 1
Figure 1
Classification of the TCGA cohort into LundTax tumor cell phenotypes. (A) The Lund advanced bladder cancer cohort (n = 307) was first grouped by global gene expression profiling. The samples were then stratified further into specific tumor cell phenotypes using IHC with antibodies for 25 proteins. Top panel: Hierarchical clustering on global mRNA data. Bottom panel: Schematic view of how tumor cell phenotypes relate to the respective mRNA cluster. (B) The same data as in panel A but reordered based on tumor cell phenotype. Using this grouping and mRNA gene expression data, a 12-group tumor cell phenotype centroid classifier (LundTax) was produced. (C) The TCGA bladder cancer dataset (n = 407) arranged according to the LundTax centroid classifier.
Figure 2
Figure 2
Validation of the LundTax classifier in the TCGA cohort. Cases in the TCGA cohort were grouped according to the LundTax classifier. Eleven gene signatures were then used to identify different tumor related features. (A) Stromal and immune cells signatures. Stromal and immune score bars show the estimated scores for tumor purity based on the ESTIMATE tool. High score (red) indicate high-level infiltration; low score (blue) indicate low-level infiltration. (B) Transcription factors involved in urothelial cell differentiation. (C) Cytokeratin and uroplakin genes. (D) Genomic circuit genes that distinguish the GU subtype from the Uro subtype. Circuit ratios were calculated for each sample as RB1 + FGFR3 + CCND1 − E2F3 − CDKN2A using log2 mRNA expression values. High ratio (red) indicate Uro, low ratio (blue) indicate GU. (E) The FGFR3 gene expression signature. (F) Expression of the KRT5, KRT14, FOXA1, and GATA3 genes, defining the Basal/Squamous-like (Ba/Sq) molecular subtype. Ba/Sq ratios were calculated for each sample as KRT5 + KRT14 − FOXA1 − GATA3 using log2 mRNA expression values. High ratio (red) indicate a Ba/Sq subtype, low ratio (blue) indicate non-Ba/Sq subtype. (G) Keratinization gene signature. (H) The cell adhesion genes EPCAM, CDH1, and CDH3. (I) The expression of the receptor tyrosine kinases EGFR, ERBB2 and ERBB3. ERBB ratios were calculated for each sample as EGFR-ERBB2-ERBB3 using log2 mRNA expression values high ratio (red) indicate EGFR expression >ERBB2 and ERBB3 expression, low ratio (blue) indicate the opposite. Gene expression color codes; red, high expression; green, low expression. Vertical lines separate major molecular subtypes; dotted lines separate subgroups of subtypes. Subtype abbreviations as in Fig. 1.
Figure 3
Figure 3
Genomic profiles of LundTax molecular subtypes in the TCGA cohort. (A) Differentially mutated genes. Black, mutation; white, wild type; gray, no data. (B) Selected differentially mutated biological processes among molecular subtypes. Three major biological processes were identified, FGFR3 signaling, apoptotic signaling pathway by TP53, and processes involved in genomic instability including RB1. Percentages in parentheses indicate the fraction of the mutated samples in the whole cohort for the given GO term. GO terms; GO:0072148, epithelial cell fate commitment; GO:1902178, fibroblast growth factor receptor apoptotic signaling pathway; GO0045839, negative regulation of mitosis; GO:0030330, DNA damage response signal transduction by p53 mediator; GO:0072332, intrinsic apoptotic signaling pathway by p53 class mediator; GO:0042149, cellular response to glucose starvation; GO:0007050, cell cycle arrest; GO:0030512, negative regulation of transforming growth factor beta receptor pathway; GO:0071922, regulation of cohesion localization to chromatin; GO:0071459, protein localization to chromosomes, centromeric region; GO:0031134, sister chromatid bi-orientation; GO0090230, regulation of centromere complex assembly; GO:0034088, maintenance of mitotic sister chromatid cohesion. (C) Selected genomic imbalances significantly (p < 0.05, Bonferroni corrected) associated with molecular subtypes. Light brown, gain; dark brown, amplification; light blue, loss; dark blue, homozygous loss. (D) Distribution of 6p22 (E2F3, CDKAL1, SOX4) and 11q13 (CCND1) amplifications across the molecular subtypes. Color codes as in panel C. Subtype abbreviations as in Fig. 1. Vertical lines, separate major molecular subtypes; dotted lines, separate subgroups of subtypes.
Figure 4
Figure 4
Mutational burden in LundTax bladder cancer subtypes. Mutational burden based on non-silent mutations in the major LundTax subtypes in the TCGA bladder cancer cohort (n = 389).
Figure 5
Figure 5
Transcription factor expression in the TCGA bladder cancer cohort. (A) Transcription factor gene clusters associated with the Uro and GU subtypes. (B) Expression of HOXA, HOXB, and HOXD families of transcription factors. Black horizontal line in the HOXD panel separate anterior and posterior HOXD-genes. (C) Transcription factor gene clusters associated with GU, Basal/SCC-like, Mes-like and Sc/NE-like subtypes. that include genes involved in late cell cycle regulation. (D) Expression of MYC-gene family members. Gene expression color codes; red, high expression; green, low expression.
Figure 6
Figure 6
Kaplan-Meier curves for 5-year overall survival. TCGA bladder cancer cohort grouped by the molecular subtype based on LundTax classification. Groups with less than 20 samples (Uro-Inf, n = 18 and Inf, n = 14) were excluded from the analysis. (A) Five-year overall survival analysis for the Urothelial-like subgroups. (B) Five-year overall survival analysis for the Genomically Unstable subgroups. (C) Five-year overall survival analysis for the Basal/SCC-like subgroups. (D) Five-year overall survival analysis for the LundTax molecular subtypes. UroB was treated separately from the merged UroA-Prog/UroC group, GU and GU-Inf was merged into one GU group. Ba/Sq and Ba/Sq-Inf were treated as two separate entities.
Figure 7
Figure 7
Comparison with UNC, MDA, and TCGA classification systems. (A) Comparison of the LundTax and UNC classification calls in the TCGA bladder cancer cohort. Top bar shows the LundTax classification of the TCGA samples. Stromal and immune score bars show the estimated scores for tumor purity based on the ESTIMATE tool. Color codes; high score (red) indicates high-level infiltration; low score (blue) indicates low-level infiltration. Ba/Sq ratios were calculated for each sample as KRT5 + KRT14 − FOXA1 − GATA3 using log2 mRNA expression values. High ratio (red) indicate a Ba/Sq subtype, low ratio (blue) indicate non-Ba/Sq subtype. Bar indicated by “BASE47” shows classification using the BASE47 classifier. Color codes, blue, Luminal; red, Basal. Bar indicated by “UNC” shows BASE47 classification with the Claudin-low 40 (BCL40) classification added. Color codes; blue, Luminal; red, Basal; green, Claudin-low. In the lower panels, heat maps of BASE47 and BCL40 signature genes are shown. (B) Comparison of the LundTax and MDA subtypes. Color codes for the MDA classification; blue, Luminal; light blue, Luminal-TP53, red, Basal; orange, Basal-TP53; green, Double negative. (C) Comparison of the LundTax and TCGA I-IV subtypes. Color codes for the TCGA classification; green, Cluster I; blue, Cluster II; red Cluster III; pink, Cluster IV. Vertical white lines separate major LundTax molecular subtypes; dotted lines, separate subgroups of subtypes.

Similar articles

Cited by

References

    1. Aine M, Eriksson P, Liedberg F, Höglund M, Sjödahl G. On Molecular Classification of Bladder Cancer: Out of One, Many. Eur. Urol. 2015;68:921–923. doi: 10.1016/j.eururo.2015.07.021. - DOI - PubMed
    1. Choi W, et al. Genetic Alterations in the Molecular Subtypes of Bladder Cancer: Illustration in the Cancer Genome Atlas Dataset. Eur. Urol. 2017;72:354–365. doi: 10.1016/j.eururo.2017.03.010. - DOI - PMC - PubMed
    1. Damrauer JS, et al. Intrinsic subtypes of high-grade bladder cancer reflect the hallmarks of breast cancer biology. Proc. Natl. Acad. Sci. USA. 2014;111:3110–3115. doi: 10.1073/pnas.1318376111. - DOI - PMC - PubMed
    1. Kardos J, et al. Claudin-low bladder tumors are immune infiltrated and actively immune suppressed. JCI Insight. 2016;1:e85902. doi: 10.1172/jci.insight.85902. - DOI - PMC - PubMed
    1. Choi W, et al. Identification of distinct basal and luminal subtypes of muscle-invasive bladder cancer with different sensitivities to frontline chemotherapy. Cancer Cell. 2014;25:152–165. doi: 10.1016/j.ccr.2014.01.009. - DOI - PMC - PubMed

Publication types

MeSH terms